Sequential layouts are the best way to handle tiered data in your graph visualizations. By popular demand, KeyLines 6.9 and ReGraph 3.6, our graph visualization toolkits, give you even more control over the structure and layout of your hierarchical data.
Whipping your wide-load layouts into shape
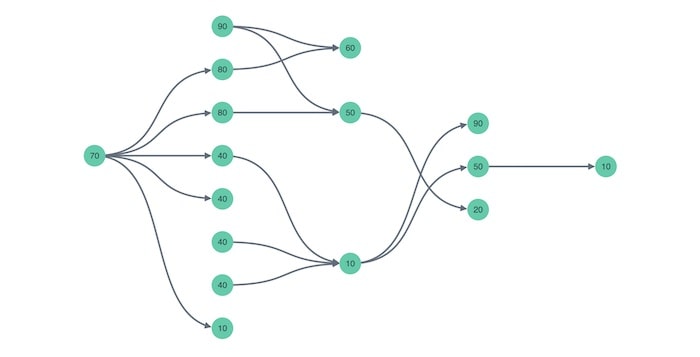
When you’re working with complex data, a sequential layout minimizes the amount of tangled links. That might be a network of communicating devices, a dataset of companies and their owners, or a set of financial transactions.
If your sequential layout contains wide trees of nodes and densely-populated levels, it can be difficult to navigate. You need to zoom right out to fit items on the chart, but you can’t make out details unless you pan around or zoom in.
Stacking and packing
The sequential layout’s new stacking option makes it easy to visualize broad structures. Stacking creates compact views of each tier at a much more readable zoom level. It saves space by pulling neighboring nodes into neat grids.
And if you’re working with a set of disconnected hierarchies rather than one big network, you can choose to visualize them in parallel and align their levels of hierarchy, or use the ‘packing’ option to arrange each individual chart in a rectangular or circular arrangement, to make better use of screen space.
Customizing nodes in levels
Another new way to help you differentiate nodes inside each level is to arrange them in a specific sequence. You can customize the node order to suit your users’ needs, for example, by bringing the most important nodes in a left-to-right layout to the top of the screen, or grouping nodes by type to give more context.
These aren’t the only improvements we’ve made to the sequential layout – you’ll also notice better symmetry in your tree structures, and reduced edge crossings.
Have a go at graph visualization
If you’re not already using our toolkits, request a free trial today and find out what a big difference we can make to your visualization project.


