Our favorite bits of the SDK that don’t get enough attention
The KeyLines software development kit (SDK) is a uniquely powerful bit of technology. In just a few lines of JavaScript code, developers turn dense data files into interactive network charts.
The KeyLines API Reference features over a hundred functions, objects and events. While this gives you ultimate flexibility to build tools, it’s easy to overlook useful functions in such a comprehensive library.
Let’s look at a few of KeyLines’ lesser-used functions that you might have missed. Enjoy!
chart.createLink
Visualizing networks can lead users to uncover connections that were previously unknown. For example, an investigator visualizing a fraud ring might be looking for connections between people. They can only understand those connections when they look at a broader network of attributes, like addresses or vehicles.
In scenarios like these, createLink lets end users draw new links in their chart.
It’s a pretty simple function that just needs the new link ID and the ID of the original node. You’ll also need to define the style of the new link. If you bind it to ‘hover’ and ‘mousedown’ events, you can build a drag-and-drop interface:

To get this working, first bind events to a function:
chart.bind('hover', addPlusIcon);
chart.bind('mousedown', startLinkCreation);
Then write code that uses createLink and adds ‘+’ glyphs so users know where to draw the link from:
// LINK CREATION CODE
function startLinkCreation(id, x, y, button, sub){
  // if the node has the plus icon on the top-right corner...
  if(sub === 'ne'){
    idCounter++;
    createLink(id, idCounter);
  // remember to return TRUE in this case to prevent default behaviour
    return true;
  }
  // otherwise just drag the node...
}
function createLink(nodeId, newLinkId){
Finally, define the style of our new link. We’ll keep it simple:
  // Define the style of the new link
  var newLinkStyle = {
    c: 'rgb(255, 127, 127)',
    t: 'New Link',
    w: 5,
    a2: true // link directed to the new node
  };
  // create the link and remove the + icon at the end in any case
  chart.createLink(nodeId, newLinkId, {style: newLinkStyle}, removePlusIcon);
  }
To see the source code, go to the Drag and Drop Items demo on the KeyLines SDK site.
chart.setProperties with RegEx
setProperties is one of the most flexible and powerful functions in the SDK. To change the properties of many items at once, you simply need to pass their IDs (as an item or array) in this format:
chart.setProperties({id: id, propertyName1: value1, propertyName2: value2 });
But what many developers don’t realise is that if you specify that useRegEx = true, passed IDs are treated as regular expressions.
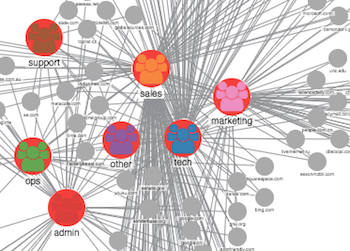
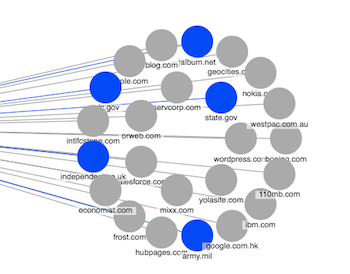
For example, in our Donuts and Email Traffic demo, we use two ID formats for the nodes:
- A department name, such as “Admin”, “Sales”, etc.
- An external domain, such as “example.com”
In this case, we can use a RegEx expression to find only the department nodes and highlight them red:
Or domains which don’t end in “.com”:
If you think carefully about your ID strategy, you can use this as a powerful way to help users navigate their networks.
chart.lock
One of the many advantages of KeyLines charts is that they’re highly interactive. But what if you need to stop your users from interacting with them? That’s where chart.lock comes in.
For example, you might lock your chart while new data loads from your database. There will always be a slight delay as KeyLines waits for a response, and you may prefer to block user actions during this time.
It’s a simple function to use:
lock(val, options)
Val is a boolean (true/false) and for the options you can use {wait: true} to show the wait icon when the chart is locked:
Deactivating your chart for the few seconds it takes to load helps users stay in control of their progress, and reduces the likelihood of errors.
chart.serialize
The chart.serialize function returns a complete serialization of the current chart format. Together with chart.load, it lets you build features that let your users save, load and share charts, as well as undo and redo.
Our Save & Load Charts demo shows a sample implementation of chart.serialize. It uses a JavaScript object, but you could use a real database if you want to store chart versions on the back end.
A handy use of chart.serialize is to create undo/redo stacks, as we showcase in our Undo/Redo demo. All we’re doing here is serializing the chart state after a user action, and adding it to an unlimited stack.
Here’s what happens when the user clicks the ‘undo’ button:
$('#undo').click(function () {
     redoStack.push(chart.serialize());
     chart.load(undoStack.pop(), refreshUI);
 });
And ‘redo’:
 $('#redo').click(function () {
     undoStack.push(chart.serialize());
     chart.load(redoStack.pop(), refreshUI);
 });
It’s a convenient, and reassuring, addition for users.
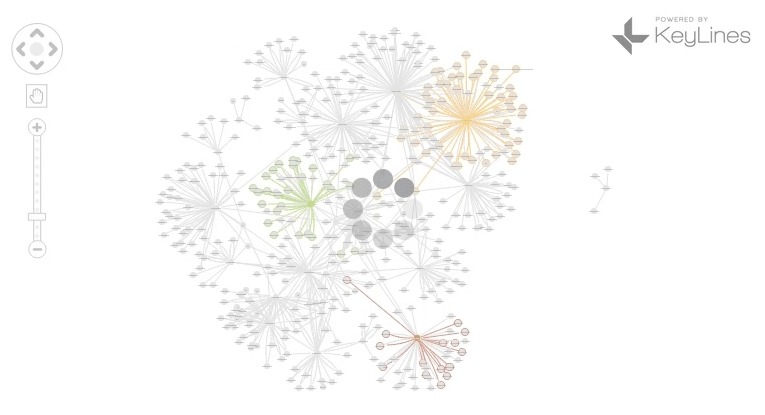
graph.clusters
We’ve written about network clustering before, but would love to see more of you using it. As the name suggests, graph.clusters help identify clusters, or communities, in your network. It does this by calculating which partitions give the lowest modularity score.
There are a few options you can pass to tweak the clustering behavior:
- Value – assigns links a weighted value, which affects the modularity score, and therefore cluster size.
- Factor – a number between 0-10 that defines how large your clusters should be.
- Consistent – set to true for the same clusters each time you run the function, or false for different results each time.
- All – lets you decide whether to run clusters on all nodes, including hidden ones.
The best place to see clusters in action is our Clusters demo. It includes helpful UX ideas, like sliders and using colors to differentiate clusters.
Try it yourself
I hope this post has given you some ideas for improving your KeyLines applications! If you’re not already a KeyLines developer, why not give it a try?
FREE: Start your KeyLines trial today
Visualize your data! Request full access to our KeyLines SDK, demos and live-coding playground.


