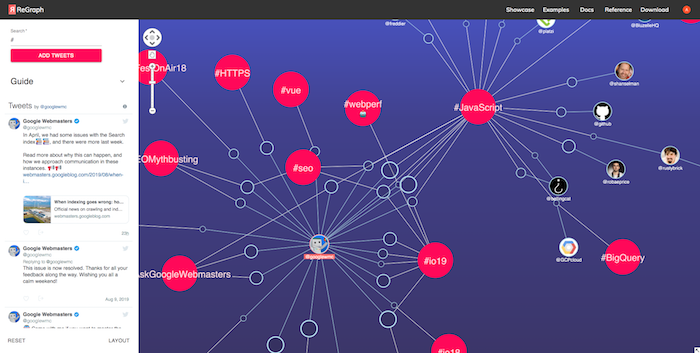
As a product manager, there are few things more satisfying than bringing a new product into the world. So last month’s v1.0 release of ReGraph, our React graph visualization toolkit, was a huge milestone.
I’ve spent a lot of time with React developers recently, learning how they work and what they need. Their insight has shaped the product available today. I noticed how much they enjoy building with ReGraph, and how certain aspects of the toolkit really have the ‘wow’ factor. So I thought I’d share them here.

Why build a graph visualization toolkit in React?
This is often one of the first questions people ask us, so let’s answer it early. At Cambridge Intelligence, we have a global reputation for outstanding graph visualization toolkits (see KeyLines, our graph visualization toolkit for JavaScript), so why build one just for the React library?
The answer is simple: developers want it.
React is the 2nd most popular JavaScript framework in the world and a lot of our customers use it, but our KeyLines-React integration didn’t always deliver the consistently excellent experience we aim for. So our team set about building a completely new graph visualization API, designed from the ground up just for React developers.
The result was ReGraph and, as you’ll discover, the developer experience is quite different from KeyLines.
1. React minded
Coding in React is fundamentally different from coding in plain JavaScript, especially when it comes to state management and component interaction.
We designed ReGraph to be as close to native React as possible, and we think we’ve achieved that. React developers ‘just get’ ReGraph.
Learning the API is quick and intuitive, with JSX demos and minimal product-related knowledge needed. It feels familiar and easy to build with right away, making it easier, faster and more enjoyable to build the powerful graph visualization tools you need.
2. State simplicity
Managing state can be tricky, especially with large and complex applications where components, or even the graph itself, can quickly get unsynchronized.
React simplifies this by passing a single data object around the UI components, defining the state. When the state changes, the app re-renders. ReGraph is no different. Every time you pass a property object (or ‘prop’) to it, ReGraph figures out whether anything has changed and how it should respond. It automatically knows when and how to rerender beautifully.
3. Declarative and data-driven API
The simple state handling means ReGraph takes a declarative approach to data: you tell it what you want, not how to do it.
Adding data from a ReGraph chart is simple. Add new nodes and links to the list of items and ReGraph ‘just does’ the rest. Removing items is equally straightforward.
We’ve also used natural language to define property names. Want a blue node called Kevin? It’s straightforward:
// A node with id N8
N8: {
   color: 'blue',
   label: {
      text: 'Kevin the Node',
  },
},
4. Quick & easy development
We’ve covered getting started with ReGraph over here, but a big selling point of ReGraph is just how quickly and easily you can build something impressive.
If you’re using the npm package manager, to get started you simply call npm-react-app to bootstrap a project, import ReGraph with React and pass it your data object. The SDK site covers all the API functions you’ll need, as well as your prop, event and style options. It also comes with 50 interactive examples showing the code and chart side by side.

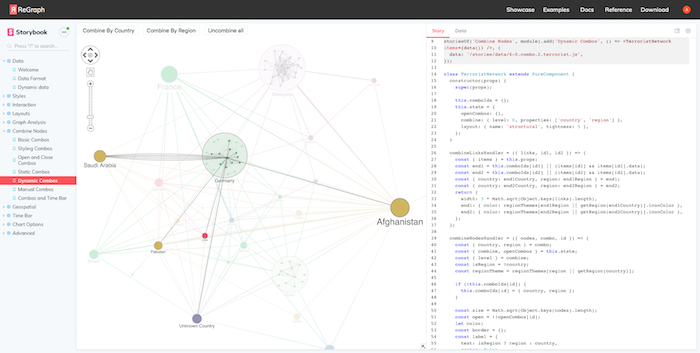
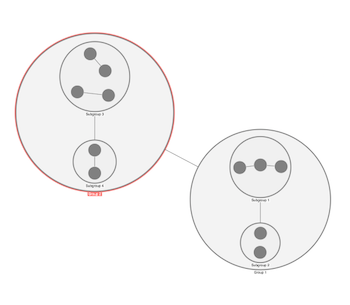
Individual functions are really simple too. Take combos, as an example. To combine nodes into a ReGraph combo, you just define your categories in your data object (e.g. Node A is part of group A and Subgroup B), then tell the chart how deeply you want to combine.

function BasicCombos(props) {
  const { items } = props;
  return (
   <Chart
    items={items}
    combine={{
     properties: ['subgroup', 'group'],
     level: 2,
    }}
   />
  );
}
5. A powerful core
Finally, as well as its flexibility and ease of use, what React developers really love about ReGraph is its power and performance.
ReGraph and KeyLines share a core engine. That means they’re equally matched in terms of graphics rendering performance, powerful graph analysis functionality, automated graph layouts, node and link grouping capbility, time-based graph analysis functionality, and so on. All the features people love in KeyLines can be harnessed in ReGraph too.
So, React developers, give ReGraph a try. We think you’ll love it.


