Product managers turn to us in their quest for new and insightful ways to see and understand the data in their applications. Graph visualization is an obvious choice – it’s an incredibly effective and intuitive way to explore complex data – but there are so many options. Should you use an open source graph visualization code library to build a solution in-house? Buy an off-the-shelf application? Or take the middle route with a commercial graph visualization software development kit (SDK) like Cambridge Intelligence has to offer?
In this (un)biased review of your options, I’ll explore two options – open source code libraries and commercial SDKs – against some important criteria to show why our visualization products should be the obvious choice.
Cost: “There’s a cheaper way to do this”

At first glance, open source technologies are attractive as they appear to be “free”. Although they have low up-front costs, they end up being expensive in other ways. Development resource, longer time to market, and on-going maintenance overhead, to name a few.
Unless you have the in-house expertise in graphics and rendering technology, open source graph visualization isn’t the most cost-effective option in the long-term. Often the total cost of ownership (TCO) of a proprietary data visualization technology is actually lower than an open source equivalent.
We’ve met a lot of developers who’ve tried to build their own graph visualization apps with open source tools. Usually, they spend a few months unsuccessfully hacking before they discover our products and make more progress in a few hours than they previously did in a month.
We’ve worked hard to ensure our graph visualization products have a shallower learning curve, excellent documentation and a faster developer experience. You also benefit from the experience and help of our support team, formed of product developers with decades of combined experience in designing and building graph visualization tools. They’ve helped thousands of developers over the years. Whatever challenges you’re facing, chances are they know a solution.
Cost isn’t the only factor to consider when deciding whether to buy an application, build something yourself or use an SDK. You also need to think about ease of integration.
Compatibility: “This technology won’t work for us”
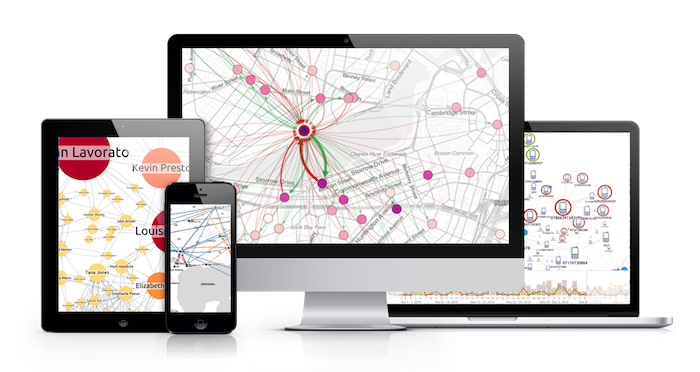
Whichever option you choose (open source or commercial) the end result must be compatible with your existing setup and be able to scale to enterprise demands.
The Cambridge Intelligence team understands this requirement, and is constantly working (and testing) to meet it.
Our products are easy to deploy. They’ll run in any modern browser, on any device. They work entirely client-side, meaning you don’t need to install specific software or create visualization infrastructure. We’ve also built connectors for the most popular graph databases, and provide options to integrate with several JavaScript frameworks, so you can code in the way that works best for you.
Every Cambridge Intelligence product release is rigorously tested on a growing array of devices and browsers. When you deploy your final product, you know it’ll work for everyone – even on the CEO’s new tablet. As exciting as a DIY project may be, open source graph visualization projects rarely take account of these requirements and companies don’t have time to solve the problem themselves.
Now let’s turn our attention to functionality.
Functionality: “We have specific functional requirements”
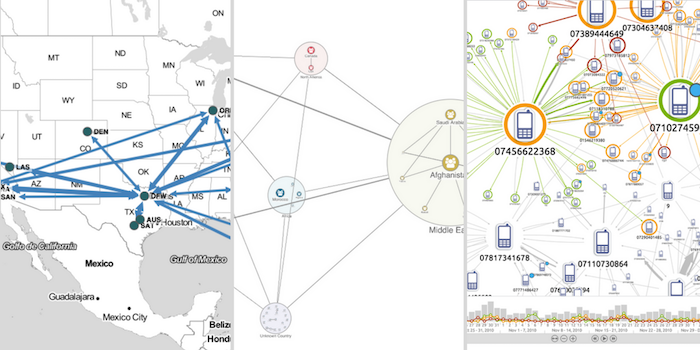
For the fastest route to data insight, your users need powerful data visualization capability, presented in a way that makes sense to them. It’s important to offer them functionality that delivers real and useful insight – whether it’s layouts, social network analysis measures, temporal analysis, geospatial analysis, the ability to group data using combos or filtering.
You could invest developer time into building that functionality with an open source library, but can you guarantee that it’ll work together as a slick, engaging experience?
We’ve worked with hundreds of companies in the cyber, fraud and law enforcement industries – among others – and we’ve figured out the workflows and user experiences that are the most powerful when it comes to delivering insight.
With our graph visualization products, you can easily build a UX that makes sense for your users, their data and the questions they need to answer.
Finally, let’s look at what happens when things go wrong.
Bugs: “When can we expect a fix?”

When there’s a bug in your software, you need to fix it fast. However, given the nature of open source, the only way for companies to fix bugs is to spend time figuring it out themselves, receive help from the community or invest in third-party support.
Bugs are rare, but when they do happen it’s our job to fix them before your users notice.
And the winner is…

Ultimately, you need to choose the option that will help your company achieve its network visualization goals, your vision, delight your end users and deliver on time. So, which is it going to be?
Want to see the benefits we can offer? Request a free trial.