This webinar explores the role of visual graph analysis and graph databases in an effective fraud detection platform.
It covers topics including:
- How companies use graph analytics for fraud detection
- The tools, workflows and techniques behind fraud detection
- How to create a visual front-end for your DataStax graph database
This webinar was co-presented with the DataStax team.
Graph analytics and fraud detection
Fraud management is a big data challenge. To detect, investigate and prevent fraud, organizations need to understand connections – between people, accounts, policies, transactions – and complex sequences of events.
Equipped with graph analytics, fraud detection teams can uncover complex patterns and relationships in data that may indicate fraudulent behavior. This is often accelerated with automated machine learning or other AI tools, which can adapt and adjust to identify increasingly complex scams, or fast-paced brute-force attacks.
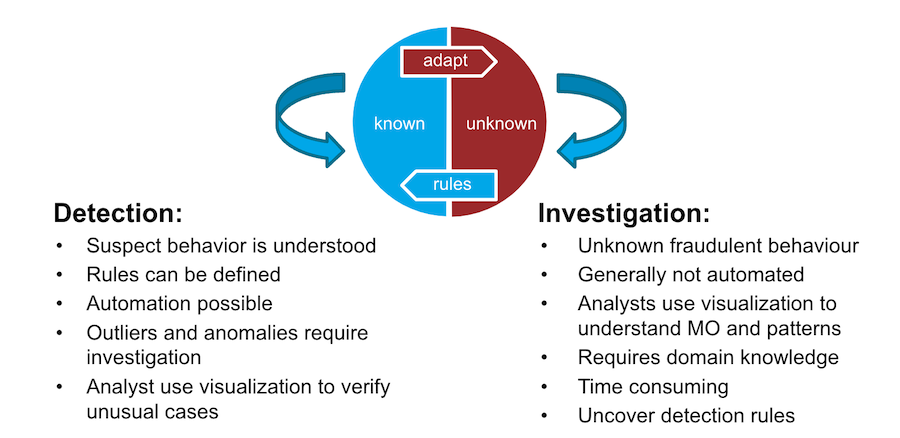
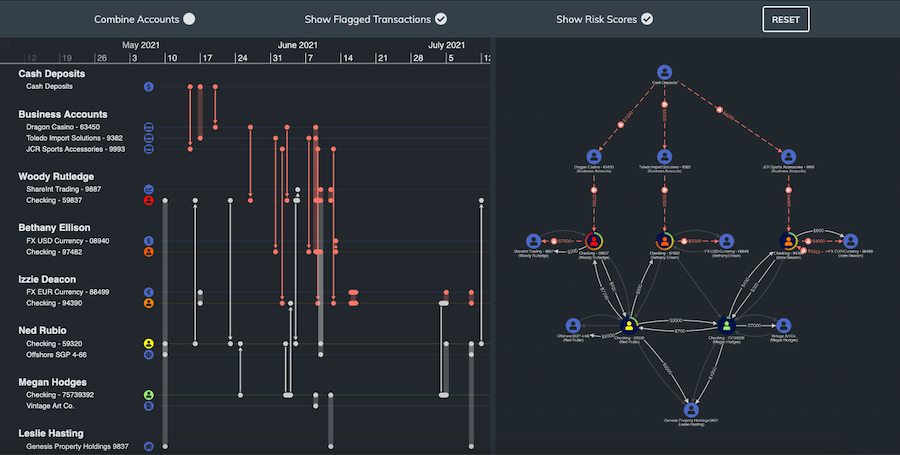
Visual graph analytics provides an interactive and intuitive way for analysts to navigate complex cases and make decisions quickly. Those visualizations can also be shared with stakeholders, documented for compliance reports or submitted as evidence in judicial processes.
Next, we discuss the ideal architecture.
While many vendors offer comprehensive fraud management platforms, a monolithic approach comes at the expense of flexibility. Instead, we discuss a customized solution, combining graph database technology with our visual graph analytics visualization tools to create a flexible architecture that grows and develops with business needs.
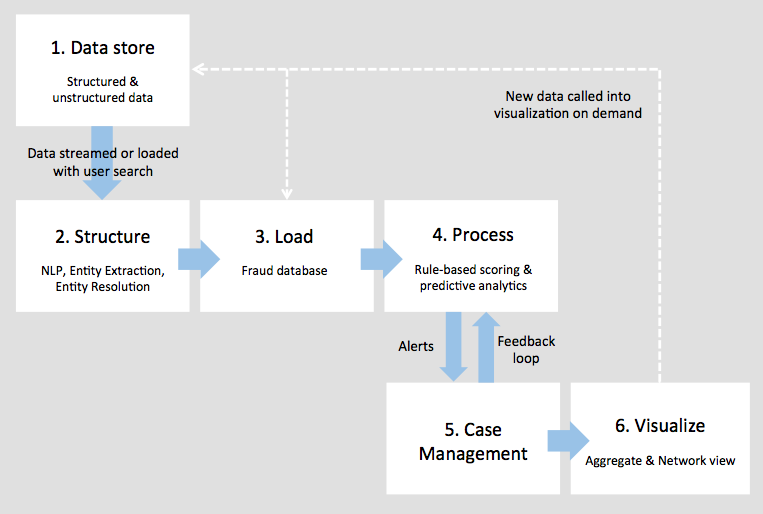
To learn more, check out our blog post on Enterprise fraud management
About DataStax
DataStax is a leading provider of database software for cloud applications. DataStax Enterprise Graph is a highly scalable graph analytics database designed for enterprise cloud applications requiring a high performance back-end capable of handling very large volumes of complex and evolving graph data.
