FREE: Link and timeline analysis for financial services compliance
Your threat landscape is constantly changing. To stay ahead, you need to understand data, quickly.
Financial institutions face a complex set of challenges. Alongside increased regulation and constant digital transformation, they’re on the front line of a range of external threats that need careful management.
As the leading provider of link analysis technologies, we’ve helped financial services organizations worldwide to build high-performance tools that manage risk and combat threats. It’s the perfect solution for many use cases in the financial services sector.
We’ve recently explored the huge impact of AI in fraud detection – in this post, we’ll look at eight other trends driving demand for better data visualization in the financial services sector.
Your threat landscape is constantly changing. To stay ahead, you need to understand data, quickly.
Risk aversion, complex legacy systems and the high profile and stakes of banking and financial services means the sector has been slower than others to embrace the SaaS revolution. Today, financial institutions are more accepting of the cloud, and the flexibility and self-service models it offers. However, this positive trend amplifies the need for robust information security.
Data visualization is a key part of understanding and explaining your information security posture, and supporting threat detection and response initiatives. Download our white paper on network and timeline visualization for cloud security to find out more about this use case.
We’ve seen financial products appearing from non-financial services providers for years – think private-label credit cards or auto loans at dealerships. But we’re now seeing an increase in financial products being integrated into the services and digital interfaces that customers use every day, from accounting software to customer loyalty apps.
Bringing link analysis and timeline visualization into an embedded financial services application gives teams – including non-specialists – an interactive, intuitive overview of their entire ecosystem, letting them detect and prevent fraud, manage risk and understand customer behavior.
The global trend in financial services is towards consolidation. That leaves many organizations facing the problem of integrating complex legacy IT infrastructures and systems. They’re often left with data silos and inefficient duplication of tasks.
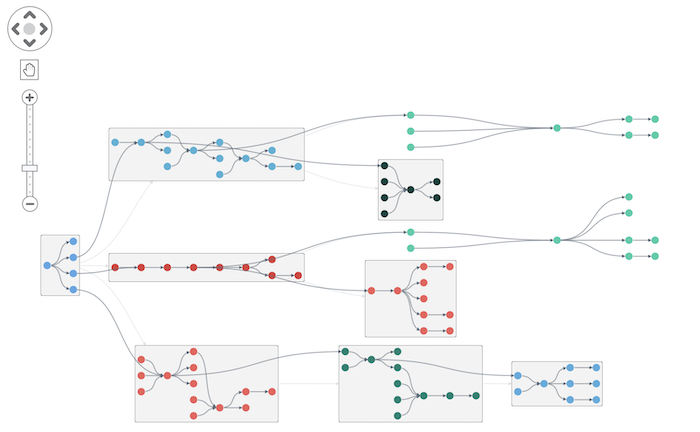
Link analysis allows investigators to visualize the most complex network infrastructure, and to analyze data across silos in a single unified view.
The increasing popularity of cryptocurrency means the market size is expected to reach $2.2 trillion by 2026. But it’s also intangible and highly volatile. It presents difficult challenges for governments, anti-money laundering analysts and financial crime investigators, as well as virtual asset service providers complying with strict regulations.
They need to clarify complex and dense blocks of transaction data fast, to identify high-risk activity. Analysts need data visualization to understand cryptocurrency exchange patterns and anomalies.
Compliance with a growing range of laws, regulations, rules and industry standards reduces operational risk and makes institutions run more smoothly. However, regulations affecting financial services change frequently, and they usually become more complicated. The process requires the collection, analysis, and understanding of complex data at scale. Link analysis, combined with interactive timeline visualization, is an excellent tool for compliance management.
Our reliance on digital services is massively increasing the attack surface for cybercriminals. Data breaches, malware attacks, network intrusions and identity theft are constant threats that institutions must manage daily. And in light of evolving cyberattack techniques, they need to prioritize data security.
Link analysis and timeline visualization, deployed alongside cyber security information and event management platforms, offer an intuitive way to understand the challenge and identify threats at scale.
Financial flows from the proceeds of crime, particularly new AI and cyber-enabled fraud, are getting more complex. They involve both fiat and virtual currencies, on and off-chain cryptocurrency, non-traditional assets such as virtual game money, and multiple cross-border movements. Only a graph visualization can communicate these complex patterns clearly, as financial institutions work to investigate and communicate new criminal trends.
Whether it’s for environmental, social, and governance (ESG)-like ratings, legal compliance, or increasing pressures from the public who want to know exactly what a fund or pension is invested in, there’s more desire today to map out the complex relationships between funds and their financial vehicles. This is often a complex hierarchy, which is well suited to a graph visualization:
For a deeper dive into the topics we’ve discussed here, download the financial services compliance white paper. You’ll find more details, including:
Or if you’re ready to see how graph and timeline visualization will improve your financial services project, request a free trial.

Visualize your data! Request full access to our SDKs, demos and live-coding playgrounds.
Registered in England and Wales with Company Number 07625370 | VAT Number 113 1740 61
6-8 Hills Road, Cambridge, CB2 1JP. All material © Cambridge Intelligence .
Privacy Policy | Security Framework


