The latest releases of our graph visualization toolkits give you more control over your nodes in open combos, with grid arrangement, auto-sizing and text wrapping.
For KeyLines users, there are also improvements to the playground, with most demos now available for you to experiment with in a live coding environment.
Full control over rows and columns in combos
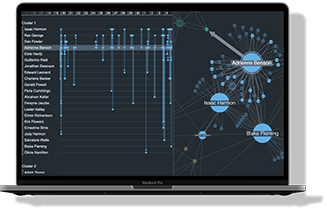
Users love the ability to arrange nodes as grids inside combos. By popular demand, we’ve added even more control over these arrangements with a new grid shape option. You can now set the grid format to display either rows or columns, and specify how many rows or columns to show.
The new option is a powerful way to visualize flows, organizational charts and supply chains with large hierarchies, especially if you pair it with our sequential layout. It also helps scale your combos for better fit and readability.
To try it out, head to our updated Combo Options for KeyLines, and Grid Arrange demos for ReGraph.
Experiment with KeyLines demos in the playground
We now offer a live coding environment for most of our demos in the KeyLines playground, so you can experiment with features at the click of a button without needing to run anything locally.
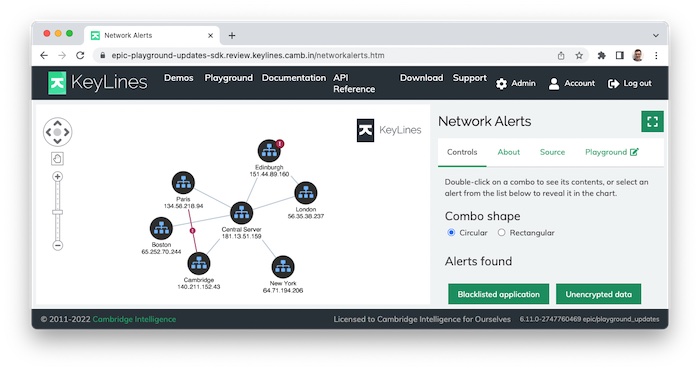
Customize demos in the way that makes the most sense for your application – you can even add your own data. To get started, open a demo and click the “Playground” option:

If you’re not already using our toolkits, request a free trial today and find out what a big difference we can make to your visualization project.


