We’ve just released KronoGraph 3.0 – a new major version of our timeline analytics toolkit – with a unique and intelligent way to present complex timelines.
Timelines are often irregular, with bursts of activity followed by empty stretches. These can be challenging to navigate and comprehend, as it takes a lot of panning and zooming for them to understand what’s happening.
We recognized the need for an interactive timescale that presents irregular timelines in a smart and explorable way. That’s why we developed nonlinear scale mode.
Streamline your timeline for faster insight
Dynamic, activity-based nonlinear scaling means investigators can examine all of the events on a timeline at once, even if they happened days, months or decades apart. They condense less significant sections of their timescale – such as periods of inactivity – and expand the parts that expose important trends, events and activities.
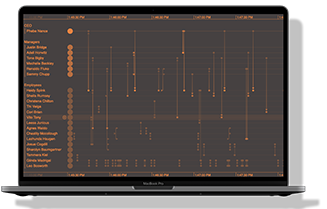
This crime data visualization is from one of our KronoGraph showcase demos. It focuses on six months of events that connect suspects, victims and police officers, on a simple timeline that gives a clear understanding of what happened and when. For a more detailed look at this showcase, see Crime data visualization: analyzing the Salisbury poisonings
Criminal investigations often follow an irregular cadence, and this is no exception. Using KronoGraph’s nonlinear timescale, events are spaced more intelligently across the timeline, showing the big picture in one single view.
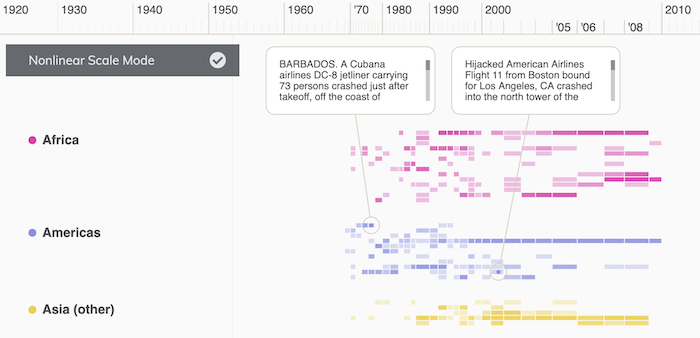
Let’s look at a much bigger timescale. This visualization of global terrorist activity spans nearly sixty years. At this scale, KronoGraph converts the chart to a heatmap view, which gives an intuitive sense of the ebb and flow of activity over the years.
The nonlinear timescale automatically expands the more active period between 2005-08, and reduces the amount of screen space given to the quieter years in the mid-80s. It’s easy to see at a glance that the early 2000s saw a huge spike in terrorist attacks.
Annotate your data to reveal the hidden narrative
Wondering about the text callouts on these two examples? That’s our other new feature, annotations. The nonlinear timescale gives more space to key events, making room for important contextual information that explains the data’s narrative.
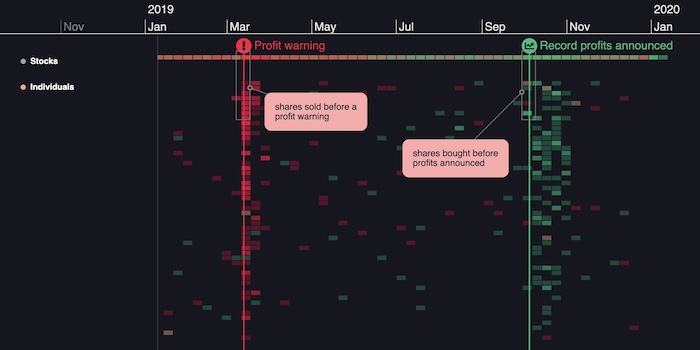
Annotations tell the story of your visualized data
If annotations form part of the original dataset, they’re brought into the timeline automatically. They can be switched on and off, but they’re protected so that the details of the investigation can’t be tampered with. For datasets that don’t include annotations at source, you can add, edit or delete them yourself, bringing out the narrative of your data when it matters.
Annotations are easy to implement. They put users in control of their data, helping them understand the most complex narrative in one clear overview. Investigations become more collaborative and insightful, with data presented in the most efficient way for storytelling and analysis. And they’re easy to export and share with collaborators and stakeholders in a way that’s accessible to anyone, even if they’re new to the investigation.
Visualize your own time-stamped data with KronoGraph
KronoGraph 3.0 is available now for all customers and evaluators to try, including new nonlinear scale mode and annotation demos, a live-coding playground and detailed developer documentation.
If you’d like a guided demo, get in touch with a member of our team and we’ll be happy to show you how it works.
FREE: Start your KronoGraph trial today
Visualize your data! Request full access to our KronoGraph SDK, demos and live-coding playground.


