Cambridge Intelligence today released a major new version of KeyLines, the industry-leading graph visualization toolkit for JavaScript developers.
Thousands of analysts worldwide rely on KeyLines-powered tools to detect financial fraud, uncover complex cyber threats and understand security risks. The latest version comes with an overhauled events engine for more flexible, natural end-user experiences.
The new events engine is consistent with the latest best practices, opening new opportunities to design tools for a wider range of devices and more advanced interactions.

Other enhancements include a new way to handle graph layouts, known as adaptive layouts.
They build on KeyLines’ existing graph layouts – powerful algorithms that identify the clearest and most insightful way to position nodes and links in a chart. Every time something is added, expanded or removed, components move just as much as they need to and no more. This makes it easier for analysts to follow specific people, accounts or devices during complex investigations.

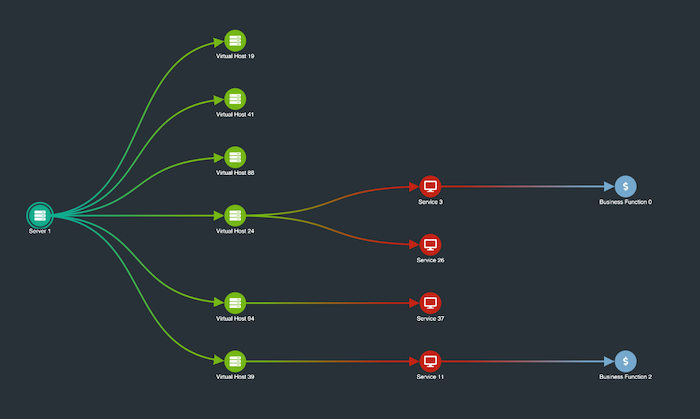
Developers can also make use of an eye-catching curved link style, giving greater clarity to data visualizations containing connections between different levels.

Dan Williams, head of product management at Cambridge Intelligence, explained the benefits of KeyLines 6.0 to developers:
“KeyLines has long been the go-to graph visualization tool for uncovering insight in graph data. With these significant enhancements to KeyLines’ events and layout engines, our team has made it easier for developers to design tools that look beautiful and behave in an instantly intuitive way. As a result, complex graph data investigations will be faster, simpler and more successful.”
KeyLines 6.0 is available now for all customers and evaluators to try, including new demos and detailed developer documentation. Request a trial to get started.


