ModalConnect has been providing secure data analysis solutions to customers for over 25 years. They know that the key to a successful collaborative investigation is a simple and intuitive shared interface that supports cooperation at each stage of the intelligence cycle.
In this blog post we’ll see how they use KeyLines, our graph visualization technology, to power the advanced visual analytics in their collaborative intelligence application.
Making connections with ModalConnect
 ModalConnect is a SaaS platform for data collection, analysis and reporting. It allows government agencies across New Zealand, Australia and elsewhere to manage and derive insights from their complex connected data quickly, securely and efficiently.
The application is used in areas such as law enforcement, corrections, defense and environmental compliance to gather intelligence and carry out investigations; and its data visualization capability is powered by KeyLines.
How does it work?
The product runs on a Microsoft Azure infrastructure and ties in with the customer’s preferred sign-on authentication method. This means it dovetails neatly into customers’ existing systems, making it perfectly straightforward for them to migrate across from their old tooling.
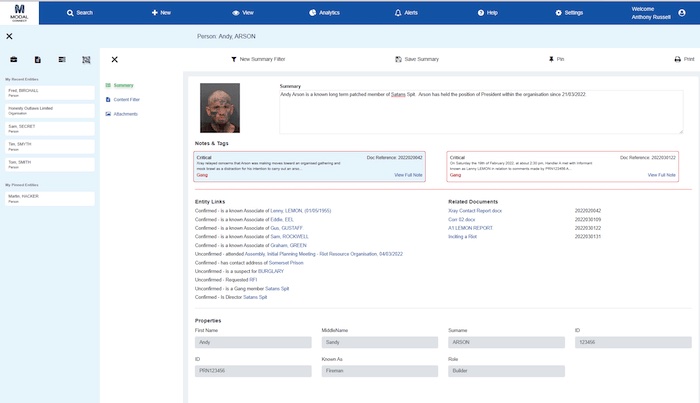
The ModalConnect dashboard is used here to show information about a person entity, along with related documents, notes and recorded connections.
There’s no coding knowledge needed to upload data to ModalConnect – it’s easy for teams, departments, organizations and public contributors to submit information. They can do this via an API, or they can use ModalConnect’s intuitive Link Forms: a secure and standardized way for people to submit data to the ModalConnect database, ready for analysis. This keeps the intelligence cycle moving along quickly, as data collection isn’t reliant on a small group of data analysts and specialists.
Once the data is uploaded to ModalConnect, it’s time to define a graph data model to turn the flat, tabular data into a graph structure. Entities become nodes, associations become links.
When you’re working with huge, dynamic datasets, the solution needs to be able to handle both size and speed. Richard Blair, Director of Customer Experience at ModalConnect, knew that KeyLines was up to the task:
‘We knew that we could trust Cambridge Intelligence to offer us the ‘best of breed’ from an analytics perspective.’
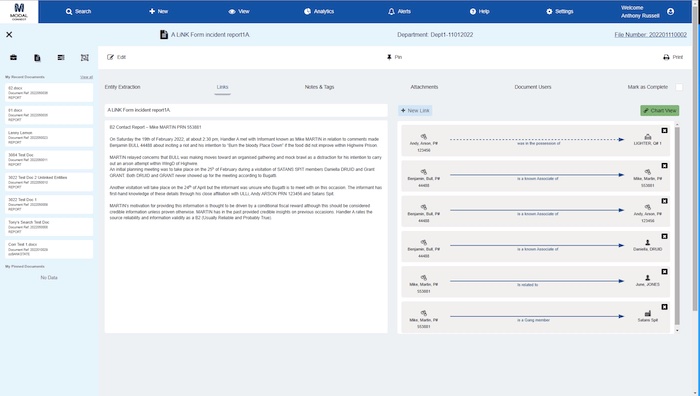
On the right of the dashboard you can see the list of entities and links related to the incident report.
As the number of links builds up, users can click the ‘Chart View’ button to get a neat overview of their connected data as a KeyLines graph visualization.
Intuitive, user-friendly visual analysis
There’s also no coding knowledge needed at the visualization stage. Anyone can use KeyLines charts to explore a network of connections, individually or collaboratively. In Chart View, the different entity and association types are displayed as labels:
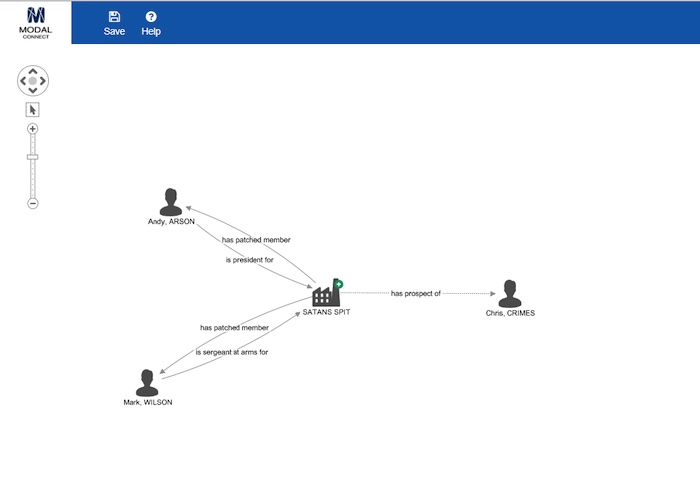
Here you can see two person entities visualized with multiple links to an organization entity.
A fully interactive visual interface lets users explore the data in our database. They can even run analytics in the front-end, trying out different graph layouts and visualizing centrality measures to explore their data from different perspectives.
Sharing intelligence with unlimited collaborators
It’s easy for ModalConnect users to collaborate with colleagues and contractors between agencies and across borders. When they’re ready to share their findings, they can disseminate information directly, or allow restricted access to the application, for as many people as they need to.
Users can assign everything from access levels for different files and documents, to user permissions for analytics and reporting tools. They can also assign tasks to colleagues to enable live project collaboration with anyone anywhere in the world.
‘Using a separate analytics platform exposes users to information stability and security risks. KeyLines works seamlessly as a ModalConnect component, meaning that our application keeps data secure, private and auditable. – Richard Blair’
ModalConnect in action: exploring a prison community
Let’s see how visualizing data with KeyLines lets ModalConnect users look beyond individual data points to understand pattern of life behavior, personal connections and incident history, and gain a 360-degree view of life in a facility. In this hypothetical example, the data contains incident reports submitted by staff.
For a correctional facility, the ‘associations’ tab of the dashboard is key: they could be family ties, gang memberships, employer/employee connections, and even adversarial relationships.
When someone writes up a report they can bring in existing information from the database or upload new entities, notes, attachments, users, incident status and so on.
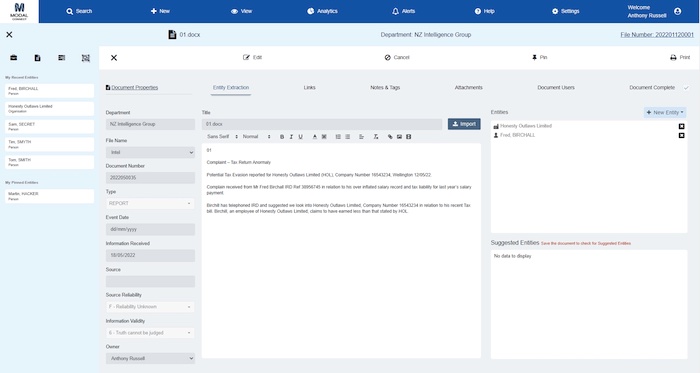
The main workflow panel: focusing on a specific incident.
Analysts then aggregate information from several reports into a single chart, and create links to get a full 360 degree view of a person or incident.
In this example, we’re building up supporting information around a specific incident. We’ve searched for entities with one degree of separation from any entity named ‘Martin’. This brings up two different people records with that name.
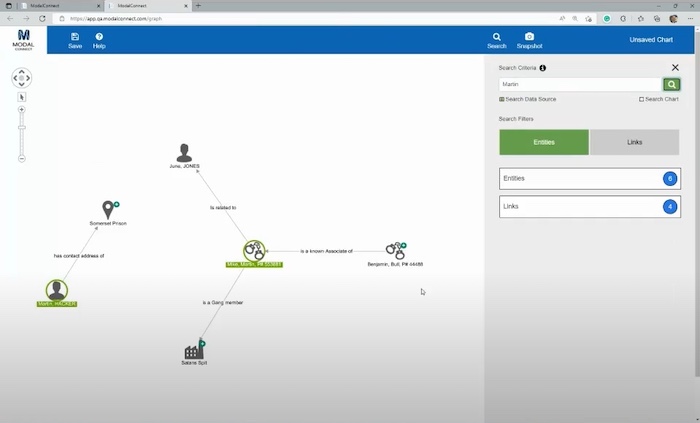
The two entities with green labels are named “Martin”. We can tell from the connections that the one on the right is the person of interest.
One of the criminals is a member of a gang, so we use the visualization to query back to the database. Clicking on the entity that represents the gang expands the chart, opening up information on other members:
Sharing snapshots: smart intelligence dissemination
Many agencies share intelligence by emailing screenshots to one another. But it takes several screenshots to convey a complex scenario – and emailing sensitive data is risky.
Intelligence dissemination with ModalConnect allows investigators to save investigations as interactive charts, and share them within the platform so that any collaborator with the necessary access rights, inside or outside the organization, can easily pick it up or integrate their own findings.
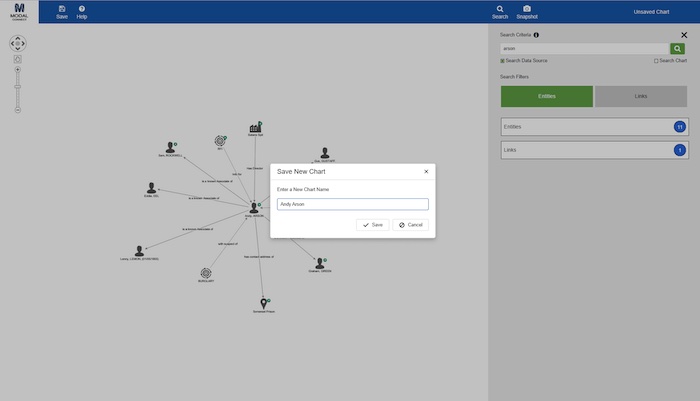
The ‘snapshot’ feature lets us save the chart as a state – meaning that we haven’t just taken a picture, but frozen it in time.
Here we’ve saved our visualization as “Andy Arson Chart”. We can browse other saved charts in the right-hand column.
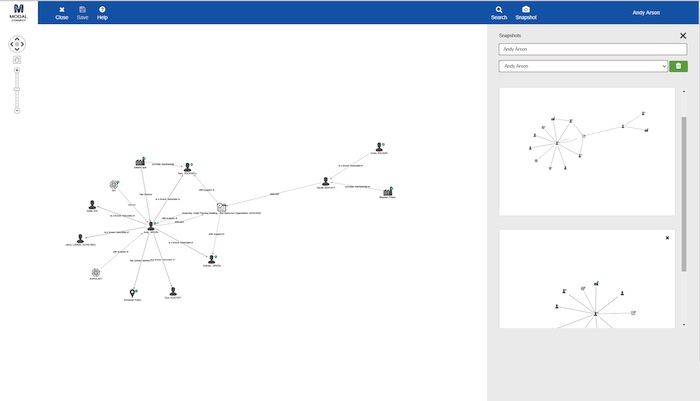
If we need to share our graphs in a more formal way, perhaps to submit as evidence in court, or to present it back to a team, we can use the snapshot feature to build a sequence of high-resolution images that tell the story. These are easy to export as a PDF, or add to a PowerPoint presentation (for more detail see our blog post on intelligence dissemination).
And when information requests come in, they can be fulfilled quickly and easily with no bottlenecks. So long as the correct permissions and mailing lists are set up, business intelligence can get to where it needs to be within minutes, whether that’s one report or a response to thousands of requests in the same day.
What’s coming next
Moving forward, we’re working with Modal to bring more sophisticated functionality to the platform, from KeyLines’ geolocation and combos to centrality measures.
Visit the website to learn more about ModalConnect’s end-to-end data management and decision support solution, with privacy of data and information security at its heart.
Ready to visualize your connected data?
Bring clarity, confidence and interactive intelligence to your product – with visualizations that transform how users understand and explore complex data.
Share: