FREE: Start your trial today
Visualize your data! Request full access to our SDKs, demos and live-coding playgrounds.
As a KeyLines or ReGraph user, you’ll already know about the things that make our graph visualization toolkits the best in show.
Ready to make your apps even more powerful? Now’s a good time to integrate with KronoGraph, our timeline visualization toolkit, as we’ve just released a new major version with unique navigation features.
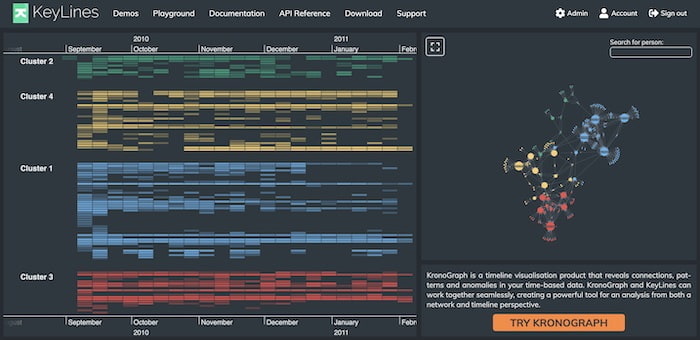
In the latest KeyLines and ReGraph versions, the hybrid network and timeline visualization demos have had a KronoGraph 2.0 makeover. You’ll see a unique view of an entire large dataset, plus get the chance to play around with the new lens.
The network view in our Timeline demos is the best way to explore relationships and connections between nodes. The examples show call data records (CDR) between student clusters to reveal patterns of behavior. To complement these insights, KronoGraph timelines offer the most efficient way to explore precisely how relationships evolved.

Notice how KronoGraph now displays every timeline in a single visualization – no more aggregating timelines into summary rows. And when you’re ready to explore the data in more detail, the lens view shines a virtual magnifying glass on your most important timelines without losing the big picture.
For news about what else in KronoGraph 2.0 will make your hybrid visualization apps even more powerful, see timeline data through a new lens.
We’re always looking for ways to make life simpler for app developers. You’ll now log into the KeyLines SDK site through Google authentication or email link authentication. No need to remember passwords!
We’ve had great feedback from organizations already working with hybrid timeline and graph visualization toolkits. Integration is smooth, the developers like working with them, and end users get two powerful views of the same data.
The easiest way to get started with our toolkits is through a free trial. We can’t wait to hear from you.