Amazon Neptune is a hosted graph database service with an engine optimized for storing billions of relationships and querying the graph with milliseconds of latency. It lets developers focus more on their applications and less on database management.
What’s special about Neptune is that it supports two different open standards for describing and querying data:
- Gremlin – a graph traversal language from Apache TinkerPop
- Resource Description Framework (RDF) queried with SPARQL, a declarative language based on Semantic Web standards from W3C
- openCypher – a declarative query language for property graphs that was originally developed by Neo4j
KeyLines works with all of these standards.
Start a KeyLines trial
To follow this visualization tutorial, you’ll need access to KeyLines.
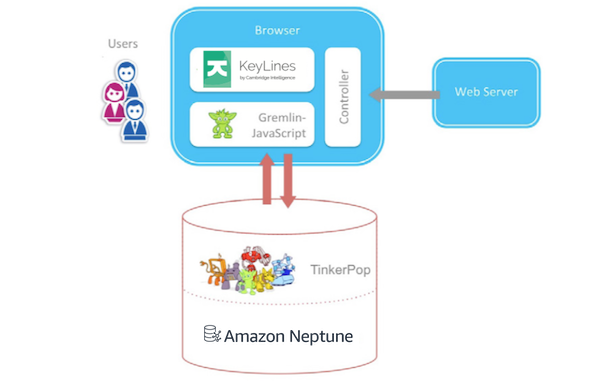
Visualization architecture
KeyLines itself is a JavaScript file that’s deployed to a web server. A chart element (powered by HTML5 Canvas or WebGL) is embedded into a web page for the user to access. Interactions with the chart raise events such as click, double-click and drag. You can then customize responses to these events to create the right user experience.
The architecture is clean, secure and fits any IT environment.
Integrate Amazon Neptune & KeyLines
This tutorial walks you through the steps to connect KeyLines to your Amazon Neptune database queried using Gremlin. (Prefer SPARQL? see our KeyLines & Amazon Neptune blog).
If you’re not using KeyLines already, sign up for a free trial. You’ll also get access to the KeyLines SDK site featuring an Amazon Neptune demo.
Step 1: Configure Amazon Neptune & load data
For full details, see AWS’s Getting Started with Neptune and Loading Data into Amazon Neptune documentation.
Step 2: Set up & configure data access
Next we’ll enable access to the loaded Amazon Neptune dataset. You’ll need to create and configure AWS Lambda function, and then expose it through the Amazon Gateway Proxy API.
For full details, see AWS’s Installing the AWS CLI and Set up Lambda Proxy Integrations in API Gateway documentation.
Step 3: Connect to the Gremlin Server
By default, the Gremlin Server uses the WebSocket channel. This makes it ideal for real-time or data streaming scenarios, but as it has a custom sub-protocol, it’s unlikely to work in its default state.
Drivers already exist for many different languages. There’s a client library for JavaScript and NodeJS called gremlin-javascript. It uses ES2015/ES6 features including JavaScript Promises for better flow control, and template strings for easier-to-read Gremlin query generation.
First, we create and Configure the client:
const connectClient = () => {
// create a gremlin client
client = new gremlin.driver.Client(configs.endpoint, {
traversalSource: ‘movies.g’,
mimeType: ‘application/vnd.gremlin-v2.0+json’,
});
}
connectClient();
Next, submit the query:
// if client still doesn’t exist, reject immediately with the last error
return new Promise((resolve, reject) => {
if (client === null) {
reject(error);
} else {
// resolve the promise if submit is successful, set a new error otherwise
client.submit(statement, bindings)
.then(resolve)
}
});
}async function returnResponse(client) {
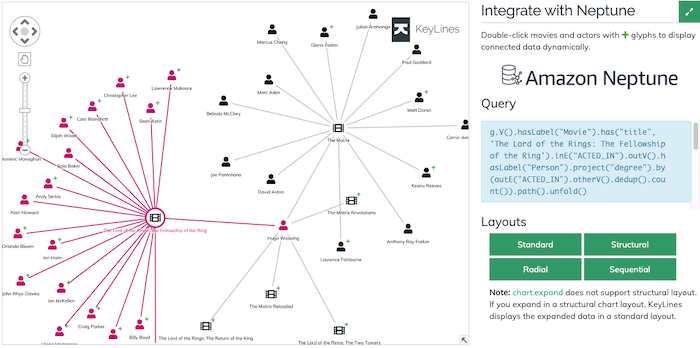
const response = await submitQuery(client, ‘g.V().hasLabel(“Movie”).has(“title”, querySearch).inE(“ACTED_IN”).outV().hasLabel(“Person”).project(“degree”).by(outE(“ACTED_IN”).count()).path().unfold()’, { “querySearch”: “The Matrix” });
return response;
}
Step 4: Convert to KeyLines JSON
To display our graph, KeyLines needs the data in its own JSON format. Let’s write a toKeyLinesFormat function to create a JSON object of nodes and links that KeyLines can recognize:
function toKeyLinesFormat(rawItems) {
const items = [];
while (rawItems.length) {
// the response format is subject to the sent query format
const [v1, edge, v2, degree] = rawItems.splice(0, 4);
items.push(makeNode(v1), makeLink(edge), makeNode(v2, degree.degree));
}
return items;
}
Step 5: Load the graph in KeyLines
The final step is to load the data in our KeyLines chart:
type: ‘LinkChart’,
items,
});
That’s it! We have a KeyLines chart that can pull data from an Amazon Neptune graph database.
Next steps: Extend the UI
Every object type, function, event and option is documented in the KeyLines SDK’s API Reference library. Use this, together with the live-coding playground, to create customized tools that’ll help your users explore and understand the data in their own Amazon Neptune graph databases.
Ready to get started with KeyLines?
To follow this visualization tutorial, you’ll need access to KeyLines.
Share: