The social network visualization challenge
Simply put, a social network is a structure of social actors joined together by connections.
If you understand this structure, you have a much deeper knowledge than if you assessed the social actors in isolation.
Powerful data visualization techniques cut through noisy social network data and reveal parts of the network that need attention.
Using our graph visualization and timeline visualization technologies, it’s quick and simple to design interactive visualizations that untangle complex social networks.
Social network visualization
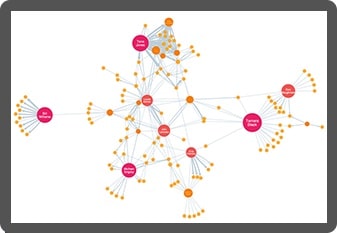
To truly understand a social network, you need to visualize it.
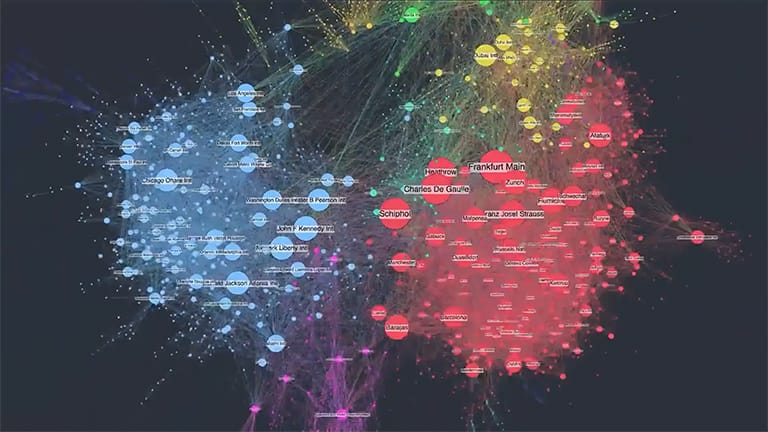
Visualizing social networks interactively offers faster and more accurate insight. Using techniques like filters, styling, and node grouping and expansion, we can explore network dynamics and connections on a micro, meso and macro scale.
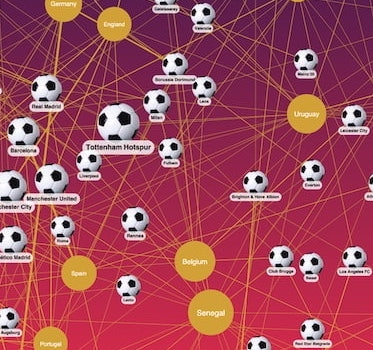
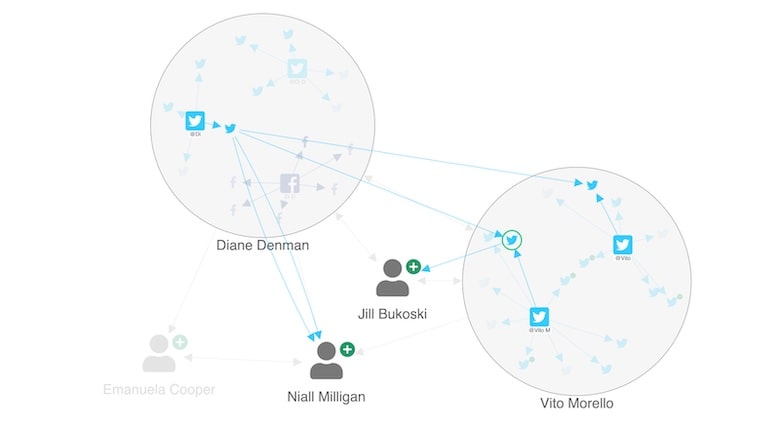
It’s easy to understand and explore a social network in graph format, using people as nodes, relationships as edges and additional information as properties.
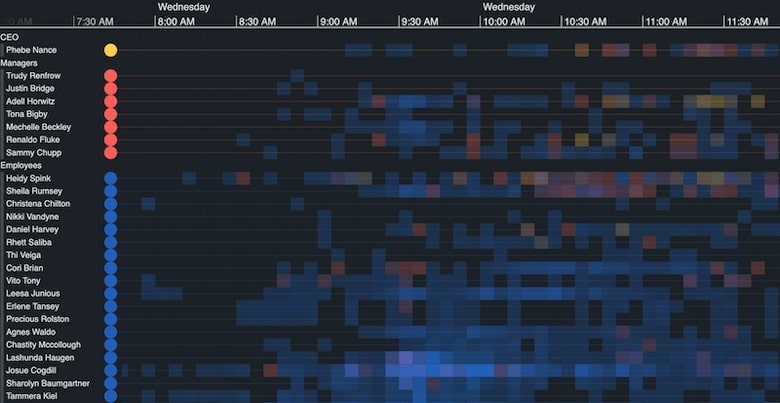
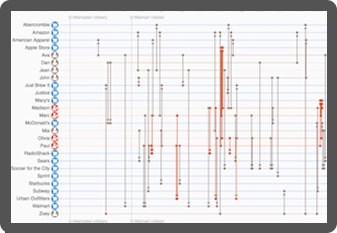
Timeline visualization reveals relationships between events over time, showing cause and effect and highlighting time patterns that wouldn’t otherwise be visible.
Learn more in our white paper
Read more about the topic of social networks and social network visualization.
Social network analysis
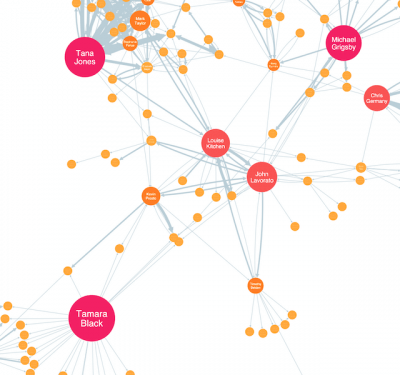
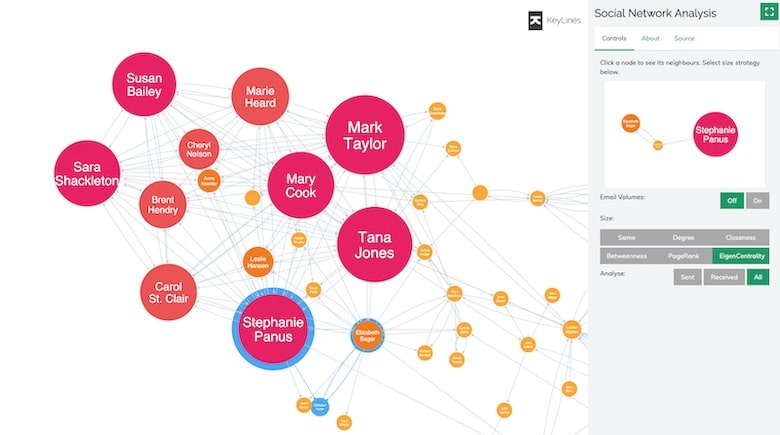
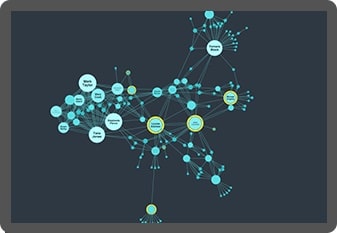
Social network analysis is a way to calculate the relative importance of nodes in a network, which helps explain how the network interacts. Using sophisticated social network analysis measures and advanced data visualization features, it’s fast and easy to understand how people, objects, and events interact.
Social network analysis measures such as degree, betweenness, closeness, PageRank and EigenCentrality are vital tools for understanding networks and identifying important nodes and relationships.
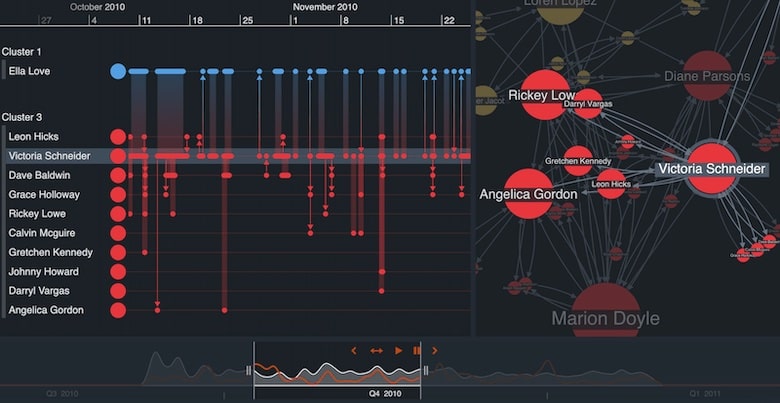
Combined with timeline view, analysts quickly see patterns of relationships as they develop.
Custom-built social network visualizations
We work with businesses, governments and software vendors worldwide to create the next generation of data visualization and exploration platforms.
Using our graph visualization and timeline visualization technologies, they’ve been able to build interactive applications that join the dots in complex critical social network data, revealing insight they need to understand.

Overcome data silos
Bring together data from across the organization in a single chart. Our flexible approach means you see the full picture and gain insight from all your data sources.

Get answers faster
Discover new dimensions to your data that aggregated methods can’t show. Timeline and graph visualization techniques lead to richer customer insight, and better, faster decisions.

Innovative network views
We work year-round to design new functionality in our toolkits. With our help, your team will have the best visualization tools to keep them one step ahead.

Custom tools that work for you
Visualization tools, custom designed for your business, users and systems, empower anyone in your organization to understand rich customer insight.
Want to try it for yourself?
KeyLines
The graph visualization SDK for JavaScript developers
KeyLines is your fast-track to graph visualization success on any tech stack.
ReGraph
Hassle-free graph visualization for React developers
ReGraph for React makes building state-based graph visualizations a breeze.
KronoGraph
Advanced timeline visualizations that scale quickly & easily
Build advanced interactive timeline views, customized for your applications.
MapWeave
The geospatial visualization SDK that uncovers every connection
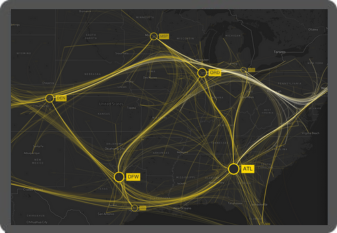
Build groundbreaking apps that make geospatial connections clear, without the clutter.