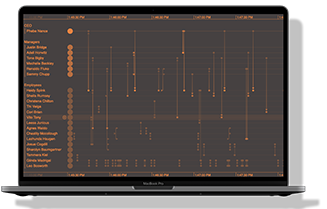
Intuitive user interactions are core to the design of KronoGraph, our timeline visualization toolkit.
In KronoGraph 1.2, we’ve made selecting and zooming to a key time range even easier, helping you create an application that delivers a user experience that feels natural and instinctive.
This release also includes a new story on how to customize dragging behavior, plus full support for shadow DOM.

Take a tour of KronoGraph
See the lens view, glyphs and more in this 20-minute video
Marquee zoom for precise timeline navigation
Transitioning smoothly from an aggregated high-level summary to individual events just got easier. With support for marquee zoom, users can home in on the exact timeline activity that’s crucial to their investigation without the need to scroll.
Transition to the marquee range is fast, no matter how many events your users are focusing on. And because KronoGraph looks good at every scale, they can find insight into the patterns and anomalies revealed at each zoom level.
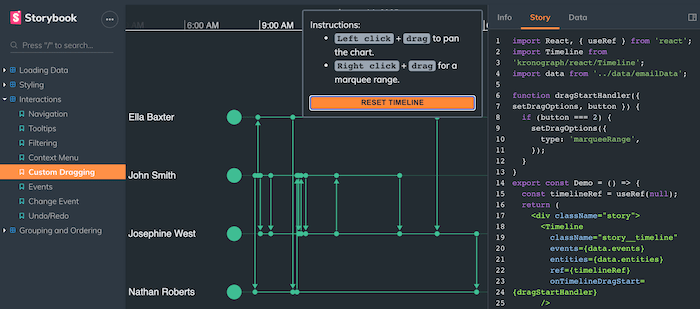
New story: Custom Dragging
To make it easier to include marquee zoom in your timeline visualization application, we’d added a Custom Dragging story to the KronoGraph SDK Storybook. It’s the best way to try this new feature for yourself before designing the exact drag behaviors your users want.
Like every other KronoGraph story, you’ll find JavaScript or React versions of the example code available to adapt and reuse.

Support for shadow DOM
KronoGraph is now fully supported when used in a shadow DOM. This gives KronoGraph greater compatibility with Web Components and related JavaScript libraries like the Polymer project.
Let’s talk about visual timeline analytics
If your application needs a time-based investigation tool, we’ll talk you through how KronoGraph can help. Just request a free trial of the toolkit to get started.


