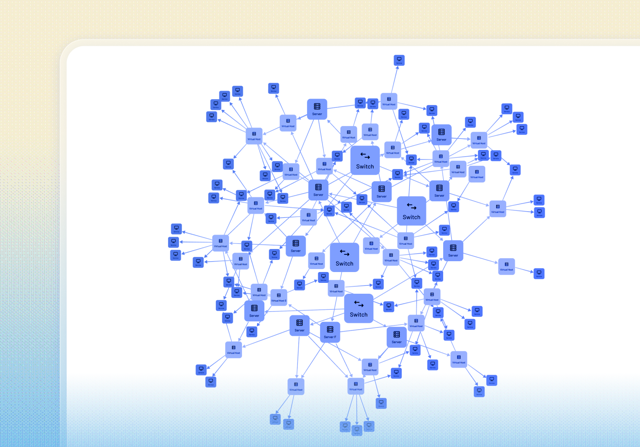
Cybersecurity
Understand cyber threats, reveal network vulnerabilities, detect malware and discover trends using visualization techniques
Transform complex data into insight with KeyLines – our graph visualization SDK for JavaScript developers.
Enjoy the flexibility to code how you like.
Add graph visualization to your applications that work anywhere, as part of any stack.
Apps built with KeyLines offer unrivalled data interaction and analysis functionality for deep graph insight.
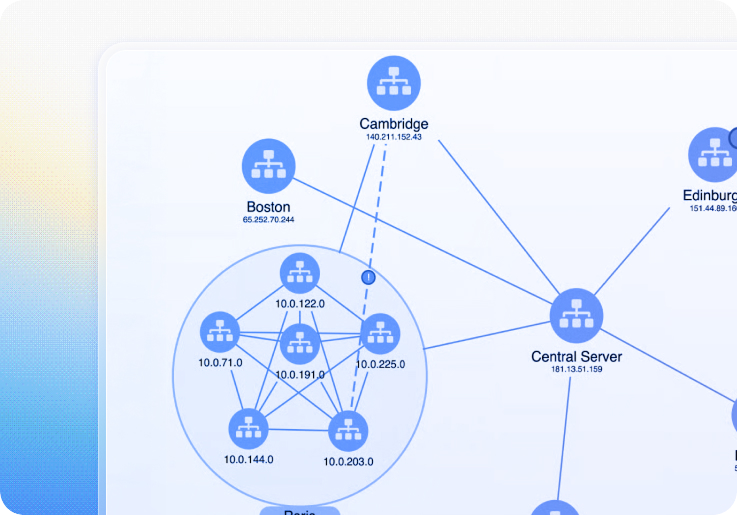
Easily incorporate graph layouts, social network analysis, filtering, geospatial mapping, time-based analysis and more.
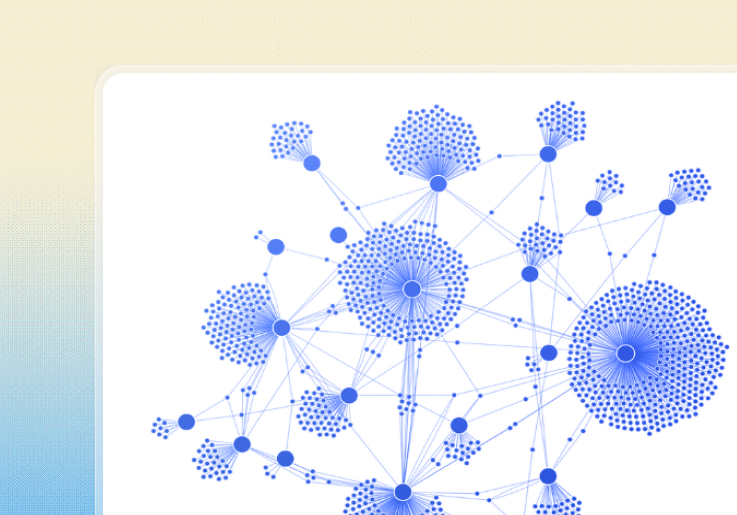
Our JavaScript graph visualization library for JavaScript developers is designed for robust performance and powerful rendering.
We’ve used WebGL and other modern web technologies plus clever code optimization for blisteringly fast visualization.
The KeyLines JavaScript graph visualization library saves weeks of development time, without compromising on flexibility or quality.
Every aspect of your application can be customized to suit you, your data and the questions you need to answer.
KeyLines apps ‘just work’ in any setup, and our developers are on hand to answer questions and give advice.
KeyLines is compatible with any browser, any device, any database and the most popular JavaScript frameworks.
Everything you need to start building effective graph visualizations
that’ll help your users find insight in connected data fast.
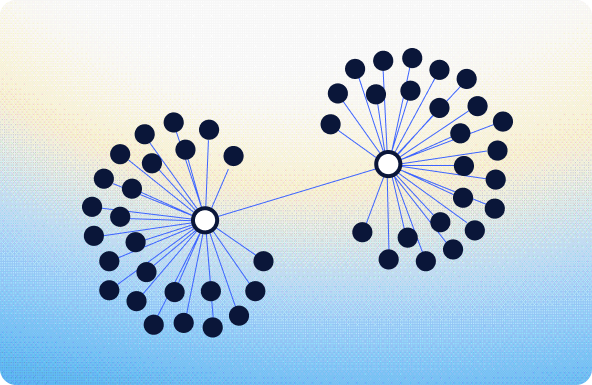
Connected data is all around us. Visualizing helps to solve some pretty big challenges.
Can’t see your use case here? Check out our use cases page.
Understand cyber threats, reveal network vulnerabilities, detect malware and discover trends using visualization techniques
We’ve designed KeyLines with a JavaScript developer’s needs in mind.
There’s a fully-documented API, step-by-step tutorials, a live-coding playground and over 70 demos.
KeyLines and ReGraph are two software development kits (SDKs) we’ve built to help developers create powerful graph visualization tools.
We’re the world’s leading supplier of graph visualization technology. From law enforcement to cybersecurity and fraud detection, we work with organizations around the globe. Every day, thousands of analysts rely on our technology to ‘join the dots’ in data and uncover hidden threats.
More than 200 customers worldwide use our SDKs, from government agencies, police forces and global banks, software vendors and technology start-ups.
Off-the-shelf applications have a defined user interface and experience built into the software – a one-size-fits-all approach. SDKs give the flexibility to design and build custom applications that look and behave as your users need them to. These custom applications are easier to use and more effective as a result. Read more about SDKs or visit KeyLines SDK & ReGraph SDK sites to view the demos and evaluate products yourself.
Yes. KeyLines is developed and supported under Cambridge Intelligence’s ISO 27001-certified Security Framework. Learn more on our Security Framework page.
Your analysts will not need coding knowledge to use network visualization applications built with our SDKs. However, you will need some JavaScript experience to build and deploy those applications. We’ve worked hard to make that process simple, with first-class support and documentation.
We’ve worked hard to ensure KeyLines and ReGraph apps ‘just work’ in any setup. You can keep your existing servers and code in your preferred JavaScript framework. We also have integration guides to help you connect to your favorite database. Check out our integrations page and developers hub to learn more.
Bring clarity, confidence and interactive intelligence to your product – with visualizations that transform how users understand and explore complex data.