It’s a question that comes up on every graph project: should you invest engineering time building on open-source tools like D3.js, or pay for a commercial platform like KeyLines that promises faster delivery and production-ready tooling? Make the wrong choice and you either waste budget on features you could’ve built yourself, or you burn weeks of dev time reinventing what already exists.
- The case for open source
- The case for commercial SDKs
- Performance benchmarks
- Interactivity & UX
- Engineering effort
- Custom code required and additional dependencies
- Which is right for your project?
I ran a practical side-by-side experiment to help you decide which is the right solution for your project. I built the same basic graph visualization in both D3 and KeyLines, then tested each against the same core requirements:
- Rendering (layout and performance)
- User interaction capabilities
- Overall developer experience
Same dataset, same interaction requirements, controlled comparison. This gives you the evidence-based data you need to decide whether to go open-source or commercial for your production graph application.
Overview: Key differences
KeyLines pros:
- Production-ready performance at scale
- Built-in interactions and layouts
- Direct engineering support
- 1/10th the development time
D3 pros:
- Free and open source
- Supports a wide range of visualization types beyond graphs (bar charts, scatter plots, maps, and more)
- Large open source community
KeyLines cons:
- Licensing cost consideration
- Less flexible than building from scratch
D3 cons:
- Requires significant custom code
- Performance degrades with scale
- Manual interaction logic
- Community support only
Now let’s look at how each tool actually performs in practice.
The case for open source
Accessibility and learning curve
Libraries like D3.js offer an excellent introduction to graph visualization concepts and let teams explore layouts, interactions, and visual encodings without any upfront licensing cost. This makes D3 particularly well-suited to proof-of-concept work, internal prototypes, and early product discovery – perfect when you’re still validating whether graph visualization fits your use case.
Community and ecosystem
Popular libraries like D3.js have large, active online communities. In many cases, common problems have already been solved by others, reducing the initial development cost. You can find code snippets, examples, and Stack Overflow answers for most common challenges.
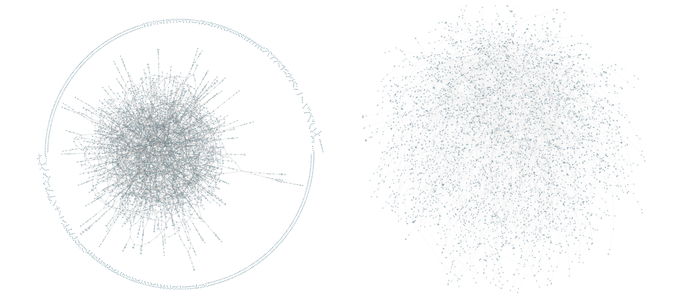
Best for smaller datasets
For low-complexity use cases like small graphs, static datasets, or limited interaction requirements, open-source libraries provide more than enough capability. Maintaining optimal performance with open-source tooling often depends on keeping graphs relatively small – typically under a few thousand nodes.
Zero upfront cost
Finally, cost is a decisive factor. For teams with limited budgets or experimental workloads, open-source provides a zero-license entry point.
The case for commercial SDKs
Dedicated support from core developers
Commercial products like KeyLines bring experience from hundreds of production deployments across a wide range of industries. This translates into practical guidance on architecture, performance tuning, and interaction design that’s difficult to get through community channels alone – dramatically reducing both development time and operational risk.
In the case of KeyLines, this support comes directly from the engineers who designed and built the product. Teams get one-to-one communication with core developers, enabling detailed discussion around architecture, layout strategy, performance characteristics, and integration patterns. This means faster issue resolution and architectural decisions backed by real production experience rather than trial and error.
Higher quality documentation
Documentation quality is much higher. SDKs reflect years of iteration, informed by user feedback. KeyLines offers clear and detailed material spanning general usage guides, framework integration documentation, worked examples, and carefully maintained developer APIs. This significantly lowers onboarding friction and makes it easier to maintain your application over time.
Optimized for performance at scale
Performance is a central design focus for commercial SDKs. These platforms are engineered to handle large graphs, complex interaction patterns, and frequent dynamic updates efficiently, using optimized rendering pipelines and carefully tuned layout algorithms. This results in consistently higher frame rates, lower interaction latency, and more predictable behavior as dataset size and visual complexity increase – sustaining smooth interaction in scenarios that would otherwise require significant manual optimization with open-source tools.
Purpose-built layouts
Rather than relying on generic force-directed approaches, commercial platforms provide specific layouts that encode meaningful structure directly into the visualization. This saves you from having to build custom layout algorithms from scratch.
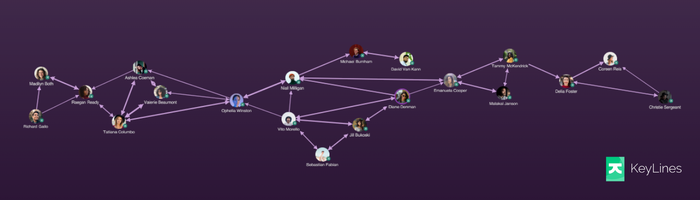
The organic layout untangles complex networks by placing connected nodes closer together and reducing link crossings. It’s a clear and reliable all-rounder for any type or size of data.
The sequential layout is designed to display data that contains a clear sequence of links between distinct levels of nodes, or data where information flows from one level to another.
Enterprise stability and security
Stability and security are equally critical considerations in production environments. Commercial SDKs like KeyLines are developed and maintained with long-term reliability as a core design objective. Release cycles are controlled, with each major version clearly documenting behavioral changes and upgrade considerations. This gives you predictable upgrade paths and reduces the risk of breaking changes disrupting your production application.
From a security perspective, commercial platforms benefit from continuous monitoring, regular patching, and dedicated processes for identifying and addressing vulnerabilities. For applications operating in regulated or air-gapped environments, this level of stability and security assurance is often a decisive factor.
Performance benchmarks
Loading items and running a layout
| KeyLines: Load (ms) | KeyLines: Layout (ms) | D3: Load (ms) | D3: Layout (ms) | |
|---|---|---|---|---|
| 10K (5k nodes, 5k links) | 110 | 661 | 110 | 2124 |
| 50K (25k nodes, 25k links) | 539 | 3300 | 355 | 11900 |
| 100K (50k nodes, 50k links) | 1000 | 11820 | 650 | 23060 |
Interactions
| KeyLines: Dragging Node (FPS) | KeyLines: Neighbours (FPS) | KeyLines: Neighbours (ms) | D3: Dragging Node (FPS) | D3: Neighbours (FPS) | D3: Neighbours (ms) | |
|---|---|---|---|---|---|---|
| 10K (5k nodes, 5k links) | 70+ | 60+ (115) | 50 | 25 | 50 | 7 |
| 50K (25k nodes, 25k links) | 45 | 90 | 150 | 5 | 6 | 35 |
| 100K (50k nodes, 50k links) | 25 | 65 | 500 | 2 | 2 | 85 |
Interactivity & UX
Pan and zoom smoothness
Both D3 and KeyLines support pan and zoom interactions, but they differ in how much work is required to get a smooth and predictable result.
KeyLines provides pan and zoom behavior out of the box, without any additional code required. The interactions are stable under load and stay smooth as the node count increases. Pan and zoom can also be enabled or disabled via a simple API call.
D3 provides pan-zoom support via its built-in d3-zoom module. Getting comparable smoothness to KeyLines requires careful coordination between the zoom transforms, rendering updates, and event handling. As graph size increases, additional optimization is required to prevent visual jitter or interaction lag.
Expand/collapse latency
Expand and collapse operations are particularly sensitive to performance since they combine layout recalculation, rendering updates, and interaction feedback in a single user action.
In KeyLines, nodes are grouped together using Combos, which support multiple hierarchical levels. The SDK provides built-in APIs for expanding and collapsing these groups, with layout updates and visual transitions handled automatically. This results in consistently low-latency interactions with smooth animated transitions, even when multiple combos are expanded or collapsed in quick succession.
In D3, nodes are typically grouped by nesting visual elements within container groups (such as SVG <g> elements). Any expand or collapse behavior must be implemented manually by updating the underlying dataset, restarting or adjusting the force simulation, and re-binding any visual elements. This introduces noticeable latency as the graph size increases and requires careful tracking of different interaction states and data consistency.
Hover/select
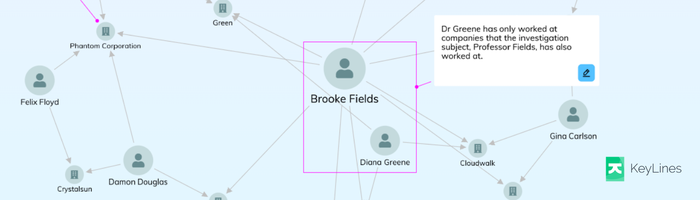
Hover and selection are core interaction patterns in any graph-based UI. KeyLines provides built-in support for hover and selection via event callbacks. This makes it straightforward to implement behaviors like node highlighting, neighbor selection, tooltips, and individual node selection without writing custom interaction logic.
D3 requires all hover and selection behavior to be implemented manually using event listeners and state management code. While this enables highly customizable interaction patterns, it also increases implementation complexity and the potential for bugs – particularly when multiple interaction modes need to work together (e.g., pan, drag, and click).
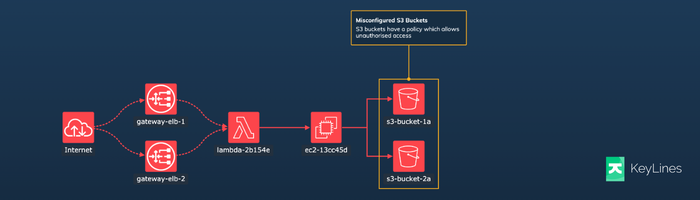
Advanced node styles
In KeyLines, advanced node styling is supported directly via a rich styling API and a library of worked examples, each with associated code that can be reused or adapted. The SDK also includes predefined styling values and configuration options for building complex nodes without having to manage low-level rendering logic.
In D3, advanced node styles are entirely possible but require significantly more manual work. Because D3 operates at a lower level of abstraction, complex node visuals must be constructed by composing SVG or Canvas elements directly and coordinating their layout, styling, and interaction behavior manually.
Engineering effort
Lines of code required to implement an equivalent visual output and interaction model:
KeyLines: ~120 lines
D3: ~350 lines
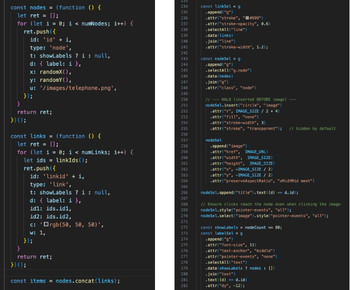
While line count alone isn’t a measure of quality, it provides a useful metric for cognitive load, potential for bugs, and long-term maintainability.
KeyLines proved significantly easier to work with than D3 for this demonstration. The SDK provides detailed conceptual documentation alongside comprehensive API references and includes clear, focused examples for individual pieces of functionality. Many of these examples can be opened directly in an interactive playground where the full source code is visible and editable.
By contrast, D3 offers a rich collection of examples that tend to focus on isolated visual outputs rather than full application workflows. Adapting them into a cohesive interactive system requires significantly more time, effort, and trial-and-error debugging.
Time required to reach a stable prototype based on having no prior experience using either product:
KeyLines: ~3 hours
D3: ~2-3 days
The D3 implementation required substantially more time, largely due to the need to design interaction logic manually and resolve subtle rendering and event handling issues. Bugs were also more difficult to diagnose, as behavior often emerged from the interaction of multiple low-level components (e.g., handling both pan and click at the same time) rather than a single, well-defined API.
KeyLines enables teams to reach a stable, feature-complete prototype with significantly less code in a fraction of the time, largely due to its higher-level APIs, integrated interactions, and structured documentation. D3 offers greater low-level control but requires substantially more custom code and debugging effort to achieve the same outcome.
In practice, this gap compounds as application complexity increases. For small, experimental projects, the additional effort may be acceptable. For production-grade systems, however, the impact on development velocity, maintenance burden, and long-term operational risk becomes much more significant.
Custom code required and additional dependencies
KeyLines
Core functionality is provided out of the box. Layouts, rendering, and interactions are all handled by KeyLines. The primary exception is map-based visualization. While KeyLines natively supports nodes with geolocation attributes, integrating those nodes into an interactive map view requires a mapping library like Leaflet. Outside of this optional mapping scenario, no third-party dependencies are needed.
D3
Multiple layouts are provided out of the box, including force-directed layout via d3-force. However, D3 remains low-level by design. While it supplies the fundamentals for layout and rendering, much of the surrounding application scaffolding must still be implemented manually. In practice, this includes event handling, drag behavior, selection state, and performance tuning.
D3 doesn’t require extra libraries to generate a force-directed layout but typically requires a significantly larger amount of glue code to assemble a cohesive, interactive application.
Which is right for your project?
Both D3 and KeyLines are capable graph visualization tools, but optimized for different priorities. D3 suits small or static datasets, prototypes, and budget-conscious projects. Its large community makes getting started easy, though production-ready applications require significant additional effort.
KeyLines is built for teams shipping production-grade applications quickly. Performance advantages become critical beyond a few thousand nodes, and built-in interactions, layouts, and styling APIs dramatically reduce custom code. Direct engineering support means less troubleshooting and more time building features.
If you’re exploring graph visualization, D3 is a solid, zero-cost starting point. But for production systems with large datasets, complex interactions, or tight timelines, the engineering time saved with KeyLines typically outweighs the licensing cost. In this comparison, KeyLines delivered equivalent functionality in roughly one-third the code and one-tenth the development time, with better performance throughout.
Discover our graph SDKs
Visit our public SDK sites: