FREE: Start your trial today
Visualize your data! Request full access to our SDKs, demos and live-coding playgrounds.
Intelligence teams often spend months trying to piece together mapping components, GIS libraries, and visualization tools to build pattern-of-life analysis capabilities from scratch. Here’s what effective pattern-of-life visualization actually requires – and how our timeline and geospatial SDKs (KronoGraph and MapWeave) can get you there faster.
It’s a technique that helps analysts across various industries understand individual and group behavior by aggregating observed data and visualizing patterns and outliers. Pattern-of-life analysis allows them to identify routine and unusual behavior, model how people might respond to different situations, and predict future activity.
The data you use for pattern-of-life analysis depends on the context, but it always comes from diverse sources – and it’s always time-based. In fact, the temporal aspect is key to identifying patterns. A single snapshot isn’t enough – we need to follow events as they unfold, to work out what typically happens when, and how often. I’d go so far as to say that pattern-of-life data is always spatiotemporal – varying across both time and space, whether that space is a physical location, a social network, or a cyber system.
We have customers across several domains who depend on pattern-of-life analysis in their daily operations. It’s not only an essential tool for crime investigations and cyber security, but also government, defense and infrastructure. Here are a few examples:
Open source intelligence (OSINT) investigations rely on multiple data sources working together. Intelligence analysts combine adtech, signals intelligence, social media data, and other sources to build profiles of criminal networks, terrorist organizations and adversarial state and non-state actors. Pattern-of-life analysis helps them predict when and where these groups are most vulnerable to disruption.
Maritime intelligence offers another example: analysts use aggregated automated identification system (AIS) data to visualize typical shipping patterns, making it easier to spot vessels taking unusual routes that might indicate suspicious activity.
In the cyber domain, analysts aggregate enterprise IT infrastructure logs, network traffic data and other sources to understand what “business as usual” looks like, and detect deviations from that norm which could indicate potential threat or criminal activity.
You’re probably familiar with adtech – if you’re sharing your location via smartphone, countless apps are collecting your movement data. Companies building smart city software can use adtech to create a digital twin of a city, and track how millions of people move through it daily, weekly, and monthly. This helps their clients (city councils, urban planners) understand where infrastructure like transport networks are over or under-used, so they can optimize for future growth.
Like smart city planning, government and defense departments use similar data sources, but to achieve different goals. For example, analysts use pattern-of-life data to understand how populations use critical infrastructure, and to allocate resources to protect the most vulnerable points. Undersea infrastructure has been a particular defence concert for Britain and the EU recently. Understanding patterns of life of vessels in the North Sea helps with protecting critical undersea cables and pipelines by making it easier to identify vessels which take atypical routes over them.
All the domains we’ve looked at prove the point I made earlier: pattern-of-life data is almost always spatiotemporal. That means that analysts will usually benefit from geospatial visualization, which can be challenging in pattern-of-life analysis for three key reasons:
The goal is to create an intuitive UX that supports rapid analysis without overwhelming investigators or hiding critical insights. With a hybrid graph, timeline and geospatial visualization, every interaction needs to be reflected across all views. Zoom in on the timeline, and the map automatically filters to show observations from that time period. Draw a bounding box on the map around entities of interest, and those same entities are instantly highlighted on the timeline. This seamless integration is what elevates separate visualization tools into a unified investigative platform.
Remember that the analyst’s workflow might start in very different places, for example:
For a flexible pattern-of-life solution that supports all of these scenarios, you need strong, scalable geospatial and temporal visualization.
When we developed our timeline and geospatial SDKs, pattern-of-life analysis was one of the key techniques we kept in mind. Since launching MapWeave earlier this year, we’ve built a showcase app that demonstrates how it can work with KronoGraph as a value multiplier in solutions designed for analysts working with spatiotemporal data.
Using the well-known open source Porto taxi trajectory dataset, we visualized nearly 1.5m observations for over 30,000 distinct journeys, driven by 30 taxis over a 2 month period. We wanted to see how far we could push both products by loading all the data into the frontend.
It’s clear to see how performant user-driven filtering of the data can be, even at scale. MapWeave handles millions of observations easily. Meanwhile, the KronoGraph timeline readily aggregates tens of thousands of events while retaining peak performance. With clever tiling and lazy loading techniques, both components could take on much more.
Earlier on, we looked at the three different stages at which an analyst’s workflow might begin. Our demo application shows how KronoGraph and MapWeave come together to cater for each scenario. Let’s take a look at each one in turn.
KronoGraph can render timelines for multiple entities at the same time, and it comes with native controls for pinning and isolating individual timelines. In this scenario, we’re investigating known entities and activities, so we pin specific timelines. The MapWeave observations layer responds by highlighting a trajectory of observation points related to those specific entities, in this case taxis:
Now we can see each taxi’s route in context, but what if we want to cut out the noise completely? KronoGraph’s ‘focus’ control lets us filter the timeline by a single entity of interest, clearing away all other routes to show only the one that matters:
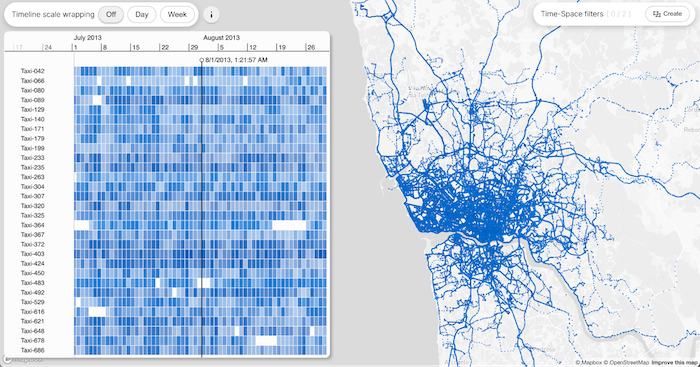
When the size of the dataset reaches a set threshold, the KronoGraph timeline automatically aggregates it into a heatmap. This gives our users a high-level pattern-of-life overview.
As they zoom into the heatmap to investigate particular areas of interest, individual taxi journeys emerge. In this example, we’ve enhanced the ‘focus’ control so that when we isolate a trajectory, the view automatically zooms to maximize screen space.
Analysts who have identified specific areas of interest will start by filtering their data by location. But what if they don’t yet know which entities are significant to their investigation? We built a feature in MapWeave that allows users to select groups of entities in an area of interest by clicking and dragging rectangular selections on the map.
In this example, we’re interested in the airport rapid pick-up parking during the early morning of August 2nd. The beauty of the integrated interface is that analysts can start with either component – navigate to the time period on the timeline and then select the area of interest on the map, or vice versa. We see that five taxis were waiting at the pickup point.
The analyst can then cross-reference this information against another time and place of interest: the main railway station carpark, the following evening. Two of the five taxis were also there – so we now have our entities of interest. The analyst can pin these entities to explore their full trajectories. Where else did they go? What drop-off points can we identify?
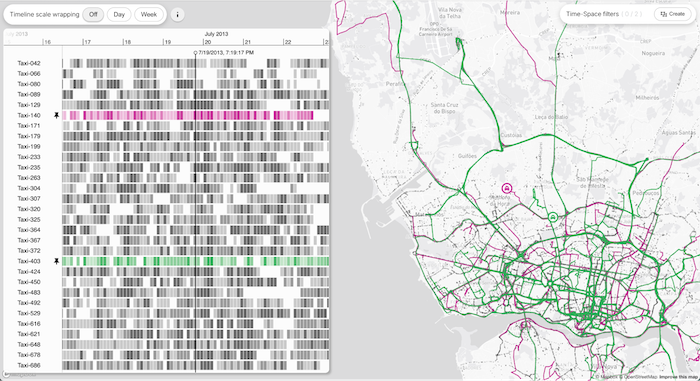
Finally, there are those times when the analyst doesn’t have a defined entity of interest, and doesn’t know where or when to start their investigation. In this situation, they need to be able to methodically explore patterns and outliers at a high level, in both space and time. KronoGraph and MapWeave make this really easy. KronoGraph’s scale wrapping feature lets users switch from a linear timeline to any cyclical time unit – in this example, we’re using daily and weekly scales.
When we switch to scale wrapping by week, we instantly see that Taxi 304 doesn’t normally work on Sundays – with one notable exception. Zooming into the timeline, we discover a single, suspicious Sunday trip.
Switching back to linear time, we can examine Taxi 304’s journey more closely. By toggling other active taxi journeys in the same time periods, we notice that Taxi 483 appears to travel along the same roads at the same time.
But overlapping trajectories isn’t necessarily proof of convoy behavior. The taxis could have been going along the same route but in opposite directions, for example. We need to see the direction of travel. We could use styling to achieve this, but a more sophisticated method is to use interactive tracker nodes.
Here’s where the real investigative breakthrough happens. MapWeave creates tracker nodes that move along trajectories, showing you exactly where entities were at any given moment. The ‘now’ point stays synchronized between map and timeline – drag a tracker along its route and watch the timeline move to match that moment in time.
As Taxi 304 follows its trajectory, Taxi 483’s tracker moves along the same path. This isn’t just two entities in the same place at the same time – they were traveling the same route in the same direction, with one closely following the other. This works both ways: scrub through the timeline and both trackers follow their routes on the map. This kind of spatiotemporal relationship that would be nearly impossible to spot in traditional data tables, but becomes immediately obvious with synchronized visualization.
Pattern-of-life analysis doesn’t have to mean months of wrestling with disparate components that refuse to work together. As you’ve seen, MapWeave and KronoGraph deliver the seamless, high-performance experience that analysts need – and that stakeholders love to see in demos.
If you’re already using or evaluating our MapWeave SDK, you can explore this showcase for yourself and try out the code in our Playground.

Visualize your data! Request full access to our SDKs, demos and live-coding playgrounds.
Registered in England and Wales with Company Number 07625370 | VAT Number 113 1740 61
6-8 Hills Road, Cambridge, CB2 1JP. All material © Cambridge Intelligence .
Privacy Policy | Security Framework


