FREE: Start your KronoGraph trial today
Request full access to our KronoGraph SDK, demos and live-coding playground
KronoGraph 2.5 – the latest version of our timeline visualization toolkit – is now available to download. Your users will benefit from new functionality that lets them manage large datasets more easily, and control the visible range of data to give better focus.
There are also two new showcases to inspire you, with powerful examples of interactive timelines from cybersecurity and law enforcement use cases.
Analysts and investigators find it harder to reveal insights from huge datasets – the vast number of events in a timeline can be overwhelming.
Users can now load data in stages, as they pan through the timeline. Zoom and pan limits manage the maximum range in view, so they’re always working with manageable chunks of information. It also keeps the amount of data loaded into the browser at an optimal performance level.
Try the new behavior in the Loading Large Datasets story on the KronoGraph SDK site.
Our latest cybersecurity showcase highlights KronoGraph’s ability to visualize busy event logs on your dashboard and find crucial alert information fast. This Detection and Response demo shows how to quickly identify the most important alerts in the network, and reveal fundamental details for root cause analysis.
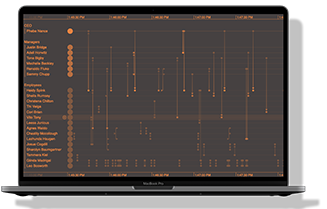
Our new Crime Investigation demo visualizes a real, complex criminal case. It provides a high-level view of the investigation, as well as individual event details to show how people and places are connected.
The showcase demonstrates best practice for using an existing KronoGraph feature: the sequence view. It helps users reduce large gaps in time, to compare individual events side-by-side and better understand the story behind their data. HTML annotations provide important details, while a separate activity bar shows a high-level view of the investigation so users don’t lose sight of the wider context.
If you’re not using KronoGraph already, you can start visualizing your timelines today. A free trial gives you access to the KronoGraph SDK site, which is full of interactive stories, code examples and beautiful showcase demos. We can’t wait to work with you.
Request full access to our KronoGraph SDK, demos and live-coding playground
Registered in England and Wales with Company Number 07625370 | VAT Number 113 1740 61
6-8 Hills Road, Cambridge, CB2 1JP. All material © Cambridge Intelligence .
Privacy Policy | Security Framework


