FREE: Start your KronoGraph trial today
Request full access to our KronoGraph SDK, demos and live-coding playground
The latest version of our timeline visualization toolkit is available now. KronoGraph 2.3 delivers greater flexibility when arranging your window display, and a practical guide to spacing events evenly across the timeline. There are also more advanced search options, giving you access to resources on the Cambridge Intelligence website.
By default, KronoGraph automatically adjusts the width of the label area to best display the entity labels in your data. But sometimes it’s important to see entire labels, no matter how long they are. Users may also want to temporarily minimize the label area to give more space to the timelines.
The new option lets you control the label area width by simply dragging the right-hand edge left or right.
Try the new behavior for yourself in our “Phone Calls” and “Terror” showcase demos on the KronoGraph SDK site.
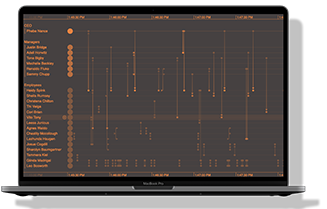
It’s not unusual for timelines to feature short bursts of activity followed by long periods of inactivity – think surges in IT network traffic, or a sudden flurry of fraudulent credit card transactions.
When events are spread too far apart or grouped too closely together, users find these uneven data patterns much harder to analyze and compare.
The solution is to space events evenly across the timeline, regardless of the actual time intervals between them.
The new “Sequence View” story on the KronoGraph SDK site shows you how to make this happen. It also includes tooltips on every event in the sequence so you don’t lose track of the actual time intervals.
If you’re a regular visitor to this website, you’re already familiar with the wealth of KronoGraph posts, tutorials and webinars available. You can now explore these resources when you run a search inside the KronoGraph SDK.
If you’re not already using timeline analysis in your data visualization project, there’s never been a better time to start. Trials are free and you’ll get expert guidance throughout your evaluation journey. Sign up today – we can’t wait to start working with you.
Request full access to our KronoGraph SDK, demos and live-coding playground
Registered in England and Wales with Company Number 07625370 | VAT Number 113 1740 61
6-8 Hills Road, Cambridge, CB2 1JP. All material © Cambridge Intelligence .
Privacy Policy | Security Framework


