FREE: Start your trial today
Visualize your data! Request full access to our SDKs, demos and live-coding playgrounds.
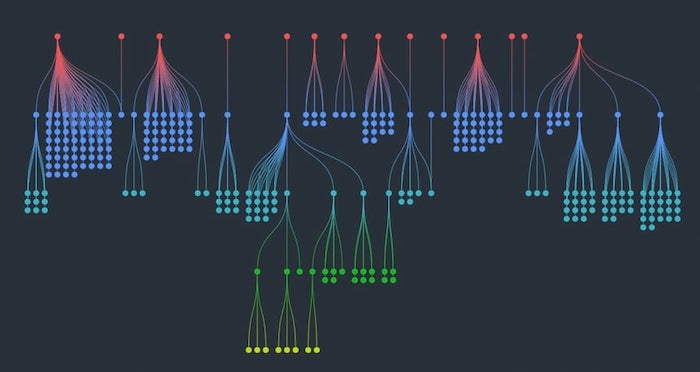
We’ve just released the latest versions of our graph visualization toolkits. KeyLines 7.1 (for JavaScript developers) and ReGraph 4.1 (for React developers), feature big performance gains and greater flexibility for our popular sequential layout. Read on to find out more.

The sequential layout is now significantly faster when you run it on a dataset where levels haven’t been specified. In tests, we’ve measured between 2 and 5 times faster depending on the dataset.
By popular demand, we’ve also added the option to sort the nodes in a sequential level in both ascending and descending order.
KeyLines users can try the new sorting option in the updated Display Hierarchies demo, while ReGraph users can check out the Hierarchies story.
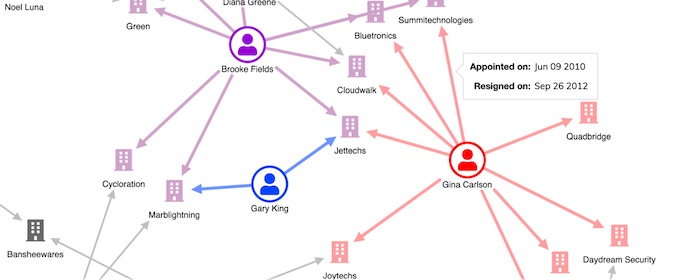
There’s now an easier way to specify which items to foreground during an interaction, and it’s 400% faster than before.
We’ve added a new Geospatial Combos story to show how to simplify geospatial networks by grouping items into combos. It’s an effective way to declutter busy map-based charts and find the location-based insights that matter.
We’ve improved the ReGraph SDK UI and extended its search capability. Now, when you run a search, there are options for your results to include the many useful ReGraph posts, tutorials and webinars available on this website.
For those of you working with KeyLines’ React component, there’s a new, improved React Integration demo. It shows font icons and tooltips, so you can include these useful features in your React applications without having to code from scratch.

The node customization innovations we released in the last version of our graph visualization toolkits have been a big hit with customers, and we’ve seen some beautiful and imaginative designs. To keep inspiring UX improvements, we’ve updated 3 popular KeyLines demos with advanced label styling: Map Layers, Insurance Fraud Analysis and Credit Card Fraud.
If you’re an existing user, as always, we recommend upgrading to these latest versions as soon as you can. And if you’re not using our data visualization suite, now is a great time to start a free trial. You’ll get all the technical support and guidance you need for a smooth evaluation.