FREE: KronoGraph white paper
Our essential guide to building powerful and intuitive timeline visualization applications.
There’s no such thing as too much performance, especially when you’re working with very large datasets.
The latest KeyLines and ReGraph versions feature big layout improvements that’ll make your graph visualization applications run faster and smoother than ever.
In KronoGraph, our timeline analysis toolkit, we now support localization, plus we’ve introduced an easy way to build integrations with KeyLines or ReGraph. You can now try out different ways of synchronizing content between the graph and timeline views in the KronoGraph playground.We’ve made strong performance improvements to our popular organic and lens graph layouts.
The organic layout untangles complex networks quickly and intuitively. As our best performing layout option, it now needs 15% fewer position calculations to complete. It also responds up to 200% faster when you add or remove items, and the node movement is better contained.
Lens layout makes it easier to spot well-connected nodes in huge datasets. You’ll find great performance improvements in your largest networks, with lens layout now running up to 2700% faster in charts of 20,000 nodes.
Lens is also the default arrangement inside circular combos, so you’ll see faster response times there too. Open combos with large networks inside now perform up to 900% faster.
You can try these improvements for yourself in our toolkits. Check out the updated KeyLines Adaptive Layouts demo, or the new ReGraph Performance story.
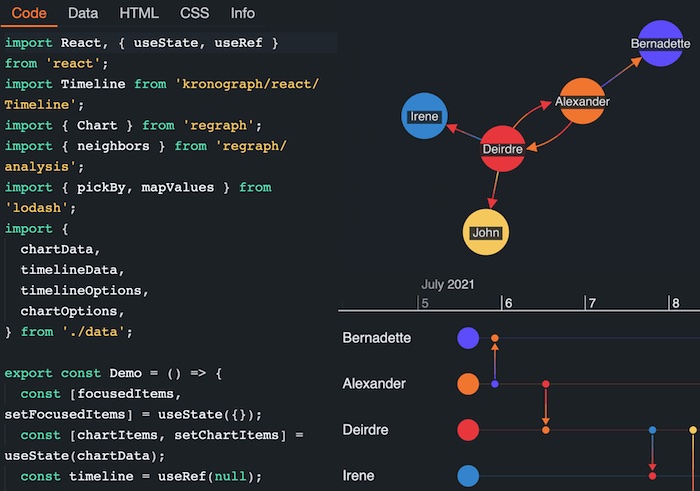
The Kronograph SDK now has its own code ‘playground’. With an interactive code editor and live visualization, it’s great for prototyping and sharing experiments with your team. You can visualize your data through KronoGraph and KeyLines or ReGraph on the same screen, making it easier to keep your timeline and graph in sync.

If you’re working with a story that includes interesting visual elements, such as tooltips or color themes, you can now open it in the playground and access the code behind the styling via a new CSS tab. It’s the easiest way to reuse the styles you like, and saves you writing CSS from scratch.
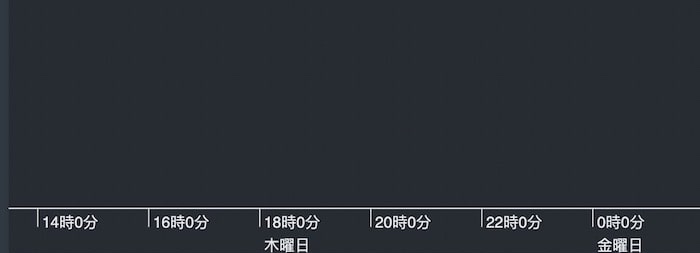
Another new feature is localization. You can now load in your own localization settings to use the language and date/time format you want, making the timeline scales easier to understand no matter where you are in the world.
