Visualizing thousands of transactions, tracking hundreds of vessels, or mapping months of timeline data creates a challenge: how do you keep the application responsive while helping users understand what they’re seeing? Our latest SDK updates focus on making large-scale visualization faster and clearer.
Adding context to complex charts
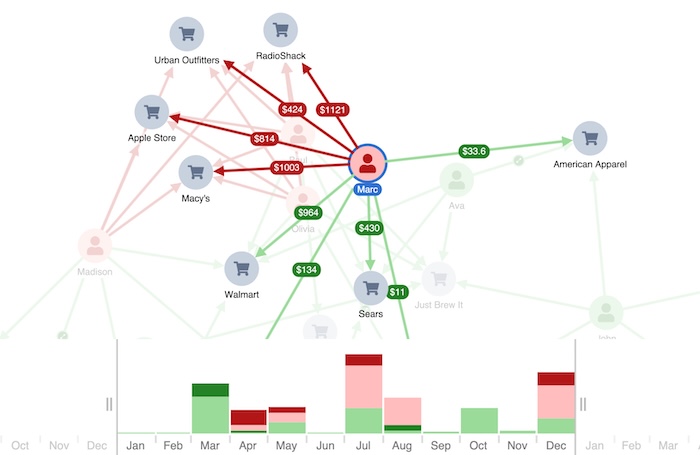
The charts that contain the most complete story are often the hardest to interpret at a glance. We’ve made annotations more flexible in KeyLines and ReGraph. You can now add them anywhere on the chart to show insights that aren’t tied to a specific group of nodes or links, giving clearer overall context.
Faster performance for large datasets
The sequential layout in KeyLines and ReGraph now runs significantly faster on datasets with 1,000+ nodes. It automatically reveals hidden hierarchies, helping you understand the structural flow of your graph data.
MapWeave addresses a different scaling problem. Previously, highlighting a vessel on hover in a dataset of millions of AIS observations meant reloading the entire data object. The new overrideStyle APIs let you restyle individual items on the fly. You can show labels, highlight paths, and handle other interactions across huge datasets without backend calls.
KronoGraph‘s new save/load functionality lets you capture complete snapshots of timeline investigations – the view range, annotations, selected entities – even with complex, multi-layered temporal data. With this approach you can zoom straight to a key view within a dataset that supports a conclusion.
More control for better space usage
KronoGraph now has a ‘justified’ entity spacing option. When you’re visualizing just a few entities, it spreads them out vertically to make better use of screen space. Labels and icons get more room at any zoom level.
And MapWeave can now draw arrows and flow animations on network links. Combined with the style override APIs, you can show directional movement in geospatial networks at scale.
See the changes for yourself
These updates give you more ways to work with larger datasets while keeping visualizations clear. Performance improvements handle the scale. Flexible annotations and styling controls add the context and interactivity. We’ve also launched MCP servers across all our SDKs to help AI agents interact with our APIs and documentation.
All these features are available now across our SDKs – request a free trial if you’re not already using our toolkits.


