Visualizing data to help users reveal insight drives everything we do. It’s why we dedicate so much development time to making every interaction – no matter how small – dynamic, intuitive and effective.
Our latest graph visualization toolkits update includes clever expand behavior in KeyLines charts where items are fixed in position, and support for a more recent version of Angular, the popular JavaScript framework.
For ReGraph users, there’s a brand new API for creating links, stylish curved links and some great new additions to the Storybook to let you code features fast.
KeyLines updates
Intuitive behavior, even with fixed items
Sometimes, users have a particular requirement to fix chart components in position so they’re always easy to find.
A new option makes sure new items expanded into the chart don’t obscure existing ones. It cleverly places new components in the most sensible position without affecting the user’s mental map of the existing fixed chart.
We’ve also made layout expand behavior smoother and more subtle, so adaptive layouts are even better at minimizing the movement of existing nodes.
Find out more in the updated Adaptive Layouts demo on the KeyLines SDK site.
Updated JavaScript framework support

We’ve upgraded KeyLines components to support a more recent version of one of the most popular JavaScript frameworks. You can now develop your graph visualization application using Angular 10.
ReGraph updates
Stylish curved links
Give your ReGraph charts a sleek makeover with beautiful curved links. They’re perfect for visualizing complex relationships, especially when used with the sequential layout to bring tiered data to life.
Need inspiration on how to apply them to your network data? Find examples in this blog post
Ready to try ReGraph?
New & improved stories
The quickest way to implement features in your graph visualization application is using stories from the ReGraph Storybook. The latest updates and additions include:
- an updated create link story featuring a new API that uses dragging to create links
- new stories showing how to fetch data from a REST API or GraphQL endpoint
- a new combos drag and drop story demonstrating how to move nodes between combos
Seen KronoGraph yet?
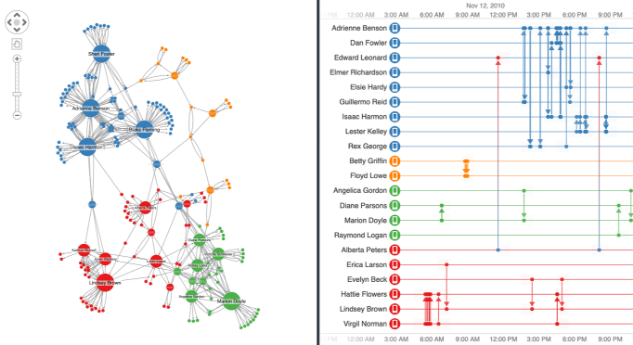
Since our last product update, we’ve launched KronoGraph, our timeline visualization toolkit that drives investigations. It’s a standalone tool that works seamlessly with KeyLines and ReGraph, giving users two powerful ways to analyze the same data.
If you’re keen to find out more about KronoGraph, get in touch.
Time to try data visualization
Ready to give your users the visualization tools they need to succeed? Request a free trial


