We recently announced the release of KeyLines 3.0 – the third major edition of our network visualization toolkit. Included in 3.0 is a brand new WebGL rendering engine for a blisteringly fast visualization experience.
In this post, we’re going to take a closer look at the technology and how it can help you ‘supercharge your charts’.
What is WebGL?
WebGL – short for Web Graphics Library – is a standard for visualizing graphics in a web browser without plugins. It is a royalty-free project, based on OpenGL and maintained by the Khronos Group.
With the help of some clever hardware acceleration, WebGL is able to achieve excellent levels of performance. It offloads much of the visualization heavy lifting to the device’s GPU, meaning it can handle more complex graphics before the frame rate drops.
In KeyLines 3.0, the new WebGL rendering component delivers up to ten times greater performance compared to our original HTML5 Canvas renderer – meaning you can visualize larger and more complex graphs than ever.
How does WebGL differ from HTML5 Canvas?
We’re big fans of HTML5 Canvas here at Cambridge Intelligence and we have no plans to stop using it. Canvas is KeyLines’ original renderer and offers a winning combination of widespread support and excellent performance.
It also has some functionality built-in that makes it a joy to use – not least the ability to render text (which is far from simple using WebGL – explaining why other visualization tools struggle to support node labels).
For a KeyLines developer, the biggest differences between WebGL and Canvas come down to support and performance:
- Support – Canvas is compatible with a wider range of legacy browsers than WebGL, Your device will also need compatible hardware to enjoy its speed, but most modern desktops, laptops, tablets and phones natively support WebGL.
- Performance – WebGL outstrips Canvas on performance, up to ten-fold. The precise increase you will see will vary according depending on your data, browser and the device you use.
How fast is WebGL?
It’s fast! The exact performance will vary depending on the device, browser and rendering engine, but you should achieve an excellent frame rate even with many thousands of elements in a chart.
Our benchmarks have shown KeyLines using the WebGL renderer is capable of running at a fluid 60 frames per second with 10,000 chart elements:
Why visualize larger networks?
We’re excited to give our customers the ability to visualize thousands, if not hundreds of thousands of data points… But stress that just because you can, it doesn’t necessarily mean you should.
In many scenarios, graph visualization is used to present complexity in a human-friendly format. Here, you should heed our previous advice of exposing the user only to the data they need to understand.
Read our post on managing very large networks.But there are use cases, especially in the cyber security domain, where people need to find clarity in huge datasets. Here, we really think the new renderer will help.
How do I integrate WebGL into my KeyLines application?
Good news! The chart API is identical for both Canvas and WebGL, so the code changes required to harness the power of the new renderer are minimal.
In the SDK, you’ll discover a couple of new functions:
- KeyLines.webGLSupport() checks if the browser supports WebGL
- KeyLines.mode(“webgl”) enables it.
And that’s it!
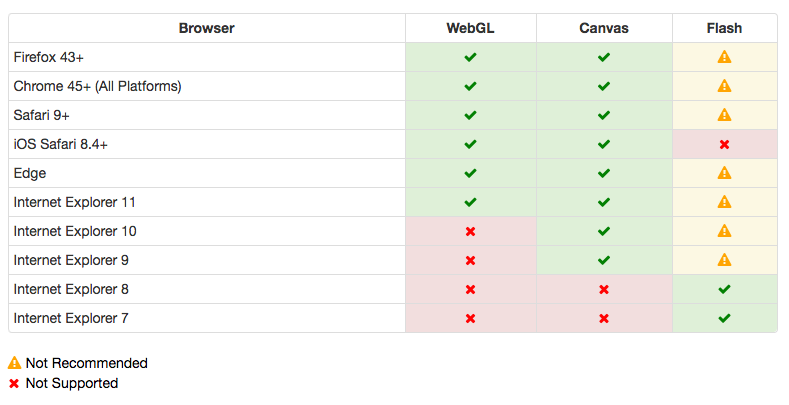
Which browsers support WebGL?
WebGL is supported by most modern browsers, with Internet Explorer 10 and earlier being the exceptions:
Can I deploy the KeyLines WebGL component now?
We strongly encourage experimentation with our new capability; your feedback will help us refine and improve it further. This exciting new capability is released initially in Alpha form: it has been fully tested by us but is not qualified or recommended for use in a production environment yet.
So, give it a try and contact our support team with your thoughts; the more feedback we receive the more quickly we can update and mature it.
Any last tips?
Our last bit of advice is to remember that drawing speed is just one factor that affects your application’s performance. KeyLines 3.0 includes a number of optimizations to our graph functions (for example, repeated neighbors call are now 50x faster) but you should also look to use a speedy datastore on the backend and optimize your own JavaScript code.
Get in touch with us if we can help.


