
One of our most frequently asked questions is: “We have millions of nodes and links, how can I load them all into the SDK?” It’s a common belief that if a few nodes can generate some insight, a few thousand nodes will generate lots of insight.
In reality, visualizing so much data in one screen is rarely useful or successful – many huge graphs are too densely connected to be usefully visualized in one go. Let’s explore some proven strategies for meaningful graph visualization at scale.
Here’s a graph with 2875 nodes and 13139 links:
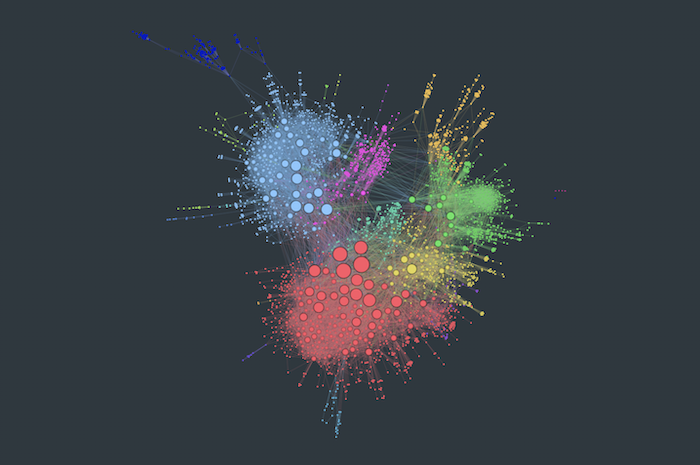
Graph visualization at scale
Although the powerful graph layout does a good job of highlighting the overall structure, the amount of insight we can get from this chart is limited. It demonstrates the four main challenges of graph visualization at scale:
1. Limited pixels – your computer monitor has a limited number of screen pixels. The more nodes and links you try to cram into a chart, the less you’ll be able to learn about them.
2. Limited human brainpower – the human brain is an incredible organ, but most adults struggle to store more than seven things in their short-term memory at once. That makes it almost impossible to interpret a chart with 40,000 items.
3. Graph hairball – in a big graph dataset, the number of links increases exponentially with nodes. Eventually, you’ll get a graph that’s so densely connected, it’s beyond the help of any automated layout.
4. Limited computer processing – while processors and graphics rendering technologies are getting more and more powerful, it’s still the case that bigger graphs will mean reduced performance. That means slower layouts and a laggy user experience.
There are two ways to get around these challenges:
1. Reduce graph density
Before tackling the scale of this graph, we should first look to reduce its density. This means taking away anything that’s cluttering the chart unnecessarily.
Aggregate your data
The obvious starting point for decluttering your data is to remove or merge duplicate and unneeded nodes.
Normally this happens on the back-end of your application, where database queries can tidy away millions of unnecessary data points in seconds. But you can also give users some front-end functionality to merge duplicates that materialize during the investigation process:
Simplify your graph data model
It’s tempting to use the same data model in your back-end and in your visualization, but this is rarely the best approach for your users.
Take this insurance fraud example. Initially, we’re loading all the data related to a case – policies, claims, claimants, incidents, repair garages, etc. In the second view we remove all the intermediates nodes and connections, leaving only claimants and garages:
If the end-user only needs to understand relationships between claimants and garages, the second graph view is much more effective.
Combine nodes
Combos are visual groupings of nodes and links. They can be opened, closed and nested, giving a really powerful way to tidy up charts.
They’re also an example of the second strategy for visualizing graph data at scale – showing sub-sections of the graph.
Show sub-sections of the graph
Now we’ve tackled graph density, we can start exploring the data in a meaningful way. We’ve seen how combos help users tidy noisy charts – they also let users explore graphs on demand. Let’s look at some other ways to help users dig deeper into their datasets.
Graph filtering
Graph filtering is another great example of this, giving users the ability to add or remove data from their view. One handy technique is to present users with an empty chart, and allow them to add data iteratively as required:
If the dataset has a timestamp, the time bar lets users select subsets of data by time frame, or pan through a time range to identify interesting activity in the network:
Using adaptive mode, our force-directed layouts (organic and standard) incrementally adjust as links form and break, making it easy to see how the network evolves.
Almost all network data has a geographic element. Geospatial visualization lets users filter map-based data so they can analyze one location at a time:
Social network centrality measures
You could also consider combining filters with social network analysis centrality measures. These algorithms identify the most important nodes in a graph, based on their relative connectivity.
This information reveals connections and sub-graphs most likely to be of interest. One example of this is kCores – repeatedly filtering nodes from the chart by their degree centrality, until we’re left just with highly connected clusters of nodes:
What if I really need to see a huge graph?
Despite everything we’ve said above, it can sometimes be useful to visualize a graph at scale before digging into specific details.
In these cases, you should make sure your visualization tool harnesses modern rendering technology and layouts optimized for performance.
There are some visual tricks you can deploy too. Link gradients make graph clusters more visible from a distance, and you can adapt your node, link and labeling styles based on zoom level:
If you’re analyzing time-based data, consider creating a timeline visualization with a heatmap view. In this example, the timeline aggregates hundreds of thousands of terror events into a heatmap:
Finally, try to ensure your solution degrades gracefully too. Reassure users with a loading screen or progress bar when performing a heavy process.
Try it for yourself
Looking for a way to perform graph visualization at scale?
We’ve built three data visualization toolkits, optimized for your biggest graph datasets. Request a trial to get started.
Share:
