FREE: Start your ReGraph trial today
Visualize your data! Request full access to our ReGraph SDK, demos and live-coding playground.
Our article on how to build a React graph visualization app using Styled Components is one of our most popular developer guides. In this tutorial, we’ll show you another way to customize your ReGraph app, using version 4 of Tailwind.
Tailwind CSS is a utility-first CSS framework for creating highly-customized user interfaces fast.
Relying on utility classes makes it easier to apply design elements consistently and build responsive designs – there’s no need for masses of CSS. It also comes with sensible off-the-shelf style defaults to get started quickly, but you’ll want to take advantage of the many customization options.
Developers choose ReGraph because it’s the best toolkit for building high-performance graph visualizations to add to their React applications.
The ability to customize every element, interface, interaction and workflow means they can create the exact design their users want. There’s also a live-coding playground to try out design ideas and share them with teammates.
This approach sits well with Tailwind CSS users. They too benefit from fast prototyping, virtually limitless customization options, and attractive color schemes for beautiful, eye-catching interfaces.
I’ll walk you through the best way to use Tailwind CSS and ReGraph to create something special.
For our Tailwind CSS tutorial we’ll use an extract from a fictitious vehicle insurance claim dataset. To see the full insurance fraud investigation in action, read Designing simple visual models that empower & delight users.
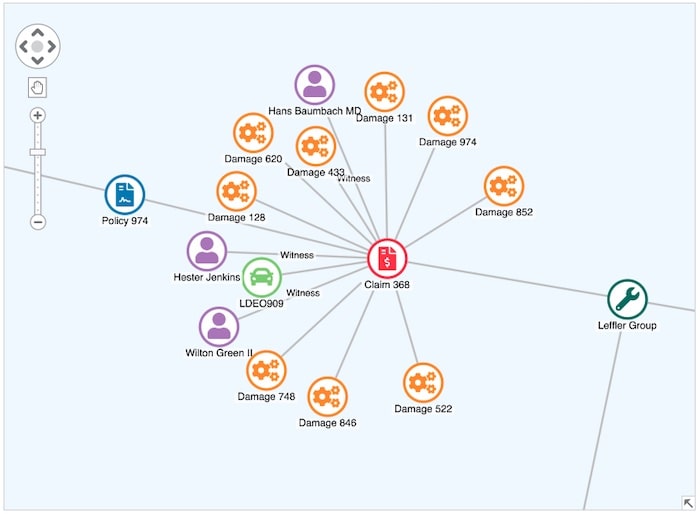
Our data connects nodes representing mechanics with the repairs they carried out on damaged vehicles. Some damage – like that caused by rear-end collisions – is far more common, but you’d also expect a range of repairs across different vehicles.
If a mechanic claims they fixed an unusually high number of issues affecting one specific vehicle part, it could be a sign of claim inflation. This is a big problem in the automotive insurance industry: policyholders conspire with fraudulent mechanics to claim for more damage than actually occurred. We’ll visualize our dataset and see what insights we can uncover.
Our data model lists how many times each mechanic fixed a specific vehicle part:
[
  { "mechanic": "Aufderhar LLC", "type": "Driver's Front Door", "count": 6 },
  ...
  { "mechanic": "Fraser's", "type": "Driver's Rear Door", "count": 14 },
  ...
  { "mechanic": "Thiel's Auto", "type": "Wing Mirror", "count": 4 }
]
We’ll save the data as src/data.json ready to import later.
Visualize your data! Request full access to our ReGraph SDK, demos and live-coding playground.
Let’s create an empty React application using Vite. You can follow the Getting Started Guide in our documentation or follow the steps below.
npm create vite@latest regraph-and-tailwind -- --react
cd regraph-and-tailwind
We include the latest version of ReGraph, downloaded from the ReGraph SDK site:
cp ~/Downloads/regraph-[version].tgz .
npm install file:regraph-[version].tgz
With ReGraph installed, we can create our first simple visualization of the data. We define a function to convert the data from the data.json file into ReGraph links and nodes. We also define two functions – styleNode and styleLink – to create ReGraph node and link objects respectively.
The link widths will scale according to the number of times a mechanic billed for repairs to a particular vehicle part.
Replace the contents of file src/App.jsx with:
import { Chart } from "regraph";
import data from "./data.json";

function styleNode(text, type) {
  const label = [
    {
      text,
      position: "s",
    },
  ];

  return { label };
}

function styleLink(id1, id2, count) {
  const width = count * 0.4;
  return { id1, id2, width };
}

function convertData() {
  const items = {};
  data.forEach((entry) => {
    const { mechanic, type, count } = entry;
    if (!(mechanic in items)) {
      items[mechanic] = styleNode(mechanic);
    }
    if (!(type in items)) {
      items[type] = styleNode(type);
    }
    items[`${mechanic}-${type}`] = styleLink(mechanic, type, count);
  });
  return items;
}

export default function App() {
  return (
    <div style={{ height: "100vh", width: "100vw" }}>
      <Chart items={convertData(data)} />
    </div>
  );
}
We’ve done enough already to create our first basic graph visualization:
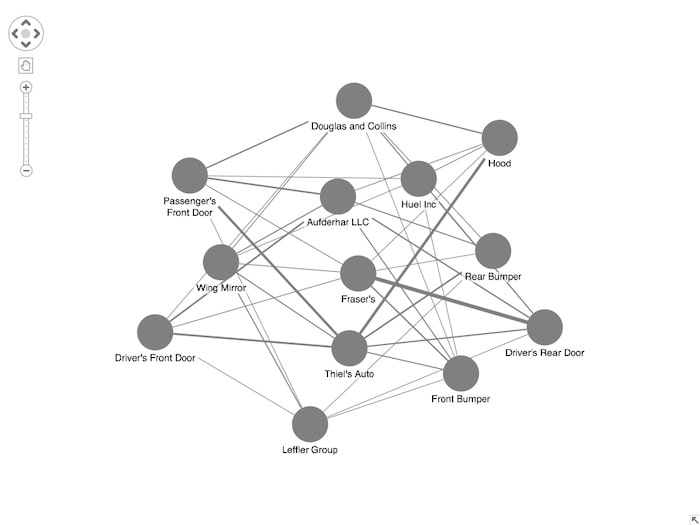
Even from this basic view, we can see from the wider links how some mechanics carried out more repairs to certain vehicle parts compared to others. That’s a useful start.
Next we install Tailwind CSS to the app by following the steps in the excellent Tailwind CSS documentation.
First, we install Tailwind and its Vite plugin. In the terminal, we’ll run:
npm install tailwindcss @tailwindcss/vite
Then we’ll update the Vite config vite.config.ts so it uses our newly installed plugin. After the edits, your config should look like this:
import { defineConfig } from "vite";
import react from "@vitejs/plugin-react";
import tailwindcss from "@tailwindcss/vite";

// https://vite.dev/config/
export default defineConfig({
  plugins: [react(), tailwindcss()],
});
As a final step, we will import Tailwind into our index.css at the top:
@import "tailwindcss";
Finally, to restart our app to redisplay our basic insurance fraud visualization, run:
npm run dev
With Tailwind added to our application, we can now access its default theme variables from our code.
To do this, we can use the getComputedStyle browser API to get the value of a theme variable on the document root. For example, to get the red-50 color, we can do:
getComputedStyle(document.documentElement).getPropertyValue(
  "--color-red-50"
)
Now, as modern Tailwind uses the OKLCH color space, we need to convert those color values to either RGB or hex format, which are the formats supported by ReGraph.
To do so, we can use any JavaScript color conversion library. In this guide, we’ll use Culori, so let’s install it. In the terminal run:
npm install culori
To import it for use, import the formatRgb method in our App.jsx:
import { formatRgb } from "culori";
With Culori installed and imported, we can use its formatRgb method to convert our OKLCH color returned by the getComputedStyle function.
With that in mind, let’s create an object that will store all the imported Tailwind values that we want to use in our application. At the top of our App.jsx, under the import statements, add the following colors object:
const colors = {
  "emerald-500": formatRgb(
    getComputedStyle(document.documentElement).getPropertyValue(
      "--color-emerald-500"
    )
  ),
  "blue-500": formatRgb(
    getComputedStyle(document.documentElement).getPropertyValue(
      "--color-blue-500"
    )
  ),
  "gray-700": formatRgb(
    getComputedStyle(document.documentElement).getPropertyValue(
      "--color-gray-700"
    )
  ),
  "gray-300": formatRgb(
    getComputedStyle(document.documentElement).getPropertyValue(
      "--color-gray-300"
    )
  ),
  "gray-50": formatRgb(
    getComputedStyle(document.documentElement).getPropertyValue(
      "--color-gray-50"
    )
  ),
  "yellow-500": formatRgb(
    getComputedStyle(document.documentElement).getPropertyValue(
      "--color-yellow-500"
    )
  ),
  "red-500": formatRgb(
    getComputedStyle(document.documentElement).getPropertyValue(
      "--color-red-500"
    )
  ),
  white: formatRgb(
    getComputedStyle(document.documentElement).getPropertyValue("--color-white")
  ),
  transparent: "rgba(0,0,0,0)",
};
Next we update our styleNode function. We add a new parameter type to it to control the node colors:
We update the labels to use gray-700 for the text against a transparent background.
function styleNode(text, type) {
  const color =
    type === "mechanic" ? colors["emerald-500"] : colors["blue-500"];

  const label = [
    {
      text,
      color: colors["gray-700"],
      backgroundColor: colors.transparent,
      position: "s",
    },
  ];

  return { color, label };
}
Update the convertData function for the two call sites of styleNode to pass in the correct node type (mechanic or damage):
function convertData() {
  const items = {};
  data.forEach((entry) => {
    const { mechanic, type, count } = entry;
    if (!(mechanic in items)) {
      items[mechanic] = styleNode(mechanic, "mechanic");
    }
    if (!(type in items)) {
      items[type] = styleNode(type, "damage");
    }
    items[`${mechanic}-${type}`] = styleLink(mechanic, type, count);
  });
  return items;
}
We also update the chart’s background color to gray-50.
export default function App() {
  return (
    <div style={{ height: "100vh", width: "100vw" }}>
      <Chart
        items={convertData(data)}
        options={{ backgroundColor: colors["gray-50"] }}
      />
    </div>
  );
}
If you want to be able to reference Tailwind values directly in your code without the need to import them via getComputedStyles you can use a library such as Tailwind Theme Resolver.
In version 3 of Tailwind, referencing values directly in JavaScript is also possible by using the resolveConfig function that is provided in the library. This option is no longer available in version 4.
With the node colors set, we’ll turn our attention to styling links. Remember, each link represents how often a mechanic claimed to have fixed damage to a specific vehicle part.
Fraud analysts have to make fast decisions about which areas of their investigation to prioritize. To make the most unusual activities stand out, we’ll color the links differently depending on how many times repairs were carried out to that part of any vehicle:
With that in mind, let’s update our styleLink function:
function styleLink(id1, id2, count) {
  const width = count * 0.4;
  let color = colors["gray-300"];

  if (count > 10) {
    color = colors["red-500"];
  } else if (count > 5) {
    color = colors["yellow-500"];
  }

  return { id1, id2, width, color };
}
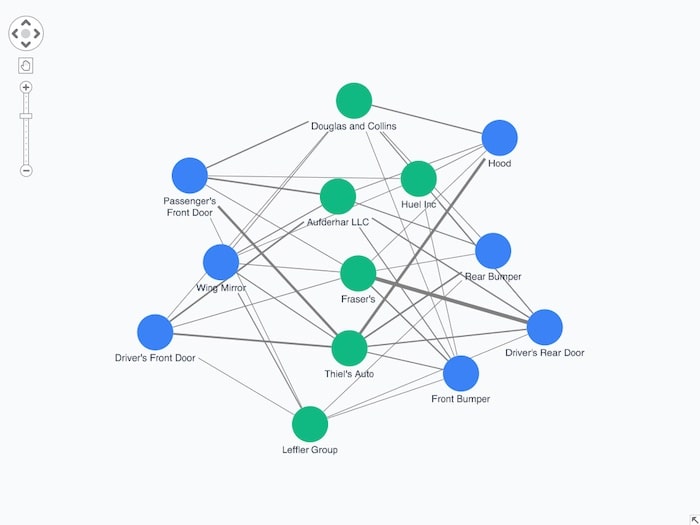
Now our graph visualization features styled links as well as colored nodes:
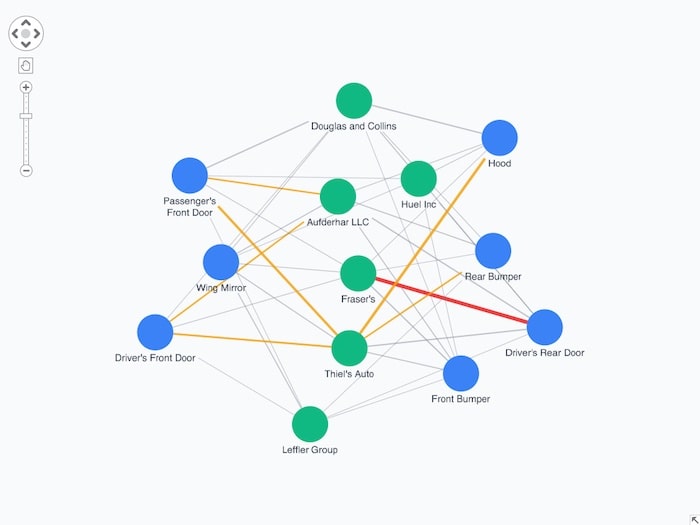
We get a clearer view of which mechanics claimed for work on a specific vehicle part more than five times, and one in particular – Fraser’s – who allegedly repaired more than ten driver’s rear doors. Suspicious?
Familiar icons make nodes instantly recognizable. We’ll use the excellent Font Awesome icon set, version 7, to show mechanics as a wrench icon (fa-wrench) and damaged vehicle parts as a set of gears (fa-gears).
We install Font Awesome icons with:
npm install @fortawesome/fontawesome-free
Then we import it into our app by following ReGraph’s documentation on font icons. At the top import the FontAwesome all.css:
import "@fortawesome/fontawesome-free/css/all.css"
Then, change the Chart’s component options prop to include the newly imported font:
<Chart
  items={convertData(data)}
  options={{
    backgroundColor: colors["gray-50"],
    iconFontFamily: "Font Awesome 7 Free",
  }}
/>
Next, we need to ensure that the fonts are loaded before the Chart component is mounted. To do so, we can use React Suspense and document.fonts.load to load Font Awesome. Let’s import those from React at the top:
import { lazy, Suspense } from "react";
We need to extract the Chart into its own component, called ChartWrapper that we can lazy load. We use the lazy React function to create a FontReadyChart component that will return our ChartWrapper as soon as the fonts have finished loading. Then we add Suspense to the App component. Suspense will then take the lazy-loaded FontReadyChart component:
// New lazy component that load ChartWrapper
const FontReadyChart = lazy(() =>
  Promise.all([document.fonts.load('900 16px "Font Awesome 7 Free"')]).then(
    () => ({
      default: ChartWrapper,
    })
  )
);

// The Chart now sits in its own new component
function ChartWrapper() {
  return (
    <div style={{ height: "100vh", width: "100vw" }}>
      <Chart
        items={convertData(data)}
        options={{
          backgroundColor: colors["gray-50"],
          iconFontFamily: "Font Awesome 7 Free",
        }}
      />
    </div>
  );
}

// The App component now only holds Suspense
export default function App() {
  return (
    <Suspense fallback="Loading fonts...">
      <FontReadyChart />
    </Suspense>
  );
}
Lastly, we update the styleNode function. This sets the correct font icon based on the type of node: fa-wrench for mechanics and fa-gears for damage types.
function styleNode(text, type) {
  const color =
    type === "mechanic" ? colors["emerald-500"] : colors["blue-500"];

  const label = [
    {
      fontIcon: {
        color: colors.white,
        text: type === "mechanic" ? "fas fa-wrench" : "fas fa-gears",
      },
      backgroundColor: colors.transparent,
      fontSize: 30,
    },
    {
      text,
      color: colors["gray-700"],
      backgroundColor: colors.transparent,
      position: "s",
    },
  ];

  return { color, label };
}
A powerful way to provide useful details about the chart without overcrowding it is by adding clever interactions. Here, we trigger an onContextMenu event by right-clicking on Fraser’s to reveal exactly how many repairs they’ve claimed for.
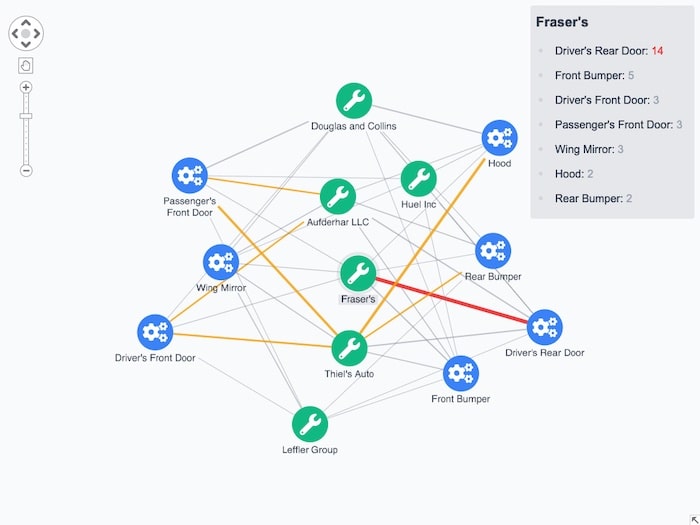
For more on this, check out 4 easy styling options for interactive graph visualization.
If you want graph visualizations styled in dark mode for improved accessibility or better aesthetics, it’s easy to achieve with ReGraph and Tailwind CSS.
Using Tailwind’s ‘dark’ variant and ReGraph’s controlTheme option, you can apply a dark theme with matching navigation and overview window controls.
I hope you found this ReGraph and Tailwind CSS tutorial useful! We’ve kept things simple here, but the scope and variety of styling options available from both libraries are huge.
If you’re ready to start designing beautiful graph visualization apps, request a free trial.
Registered in England and Wales with Company Number 07625370 | VAT Number 113 1740 61
6-8 Hills Road, Cambridge, CB2 1JP. All material © Cambridge Intelligence .
Privacy Policy | Security Framework


