FREE: Start your KeyLines trial today
Visualize your data! Request full access to our KeyLines SDK, demos and live-coding playground.
What’s your Wordle starter word? Hopefully it’s not “Jazzy”.
I used KeyLines, our graph visualization toolkit, to create a chart that shows which word will give you the best tactical advantage when you start a new game.
Wordle is an online game that gives you six chances to guess a five-letter word. Each guess reveals information about the word’s letters and their order, by color-coding the letters green for a hit, gray for a miss, and yellow if misplaced.
The data I needed to create my chart is right there in the source code. If you’re a fan of data analysis – or just a great big spoilsport – all you need to do is right-click on the Wordle webpage to “View Page Source” and you’ll find not only the word list, but also the algorithm that can tell you the word of the day.
The source code includes a list of over 10,000 words that Wordle knows, as well as the shortlist of 2000 words that have been earmarked for use as puzzle solutions. I wrote a program that calculates all the possible results that Wordle could return, for each of the words it recognizes. It also calculates the number of possible solutions that you’re left with, for each of those results. With this info we can work out the best starter word – the one that will rule out the maximum number of options.
As you can imagine, we’re now working with a lot of information. This is where KeyLines comes into its own, by letting me visualize the data in a customizable chart. There are several different layout styles to choose from – I used a radial layout that centers on an individual word, with branches for each possible result. We can choose any recognized starter word and ask KeyLines to do its thing.

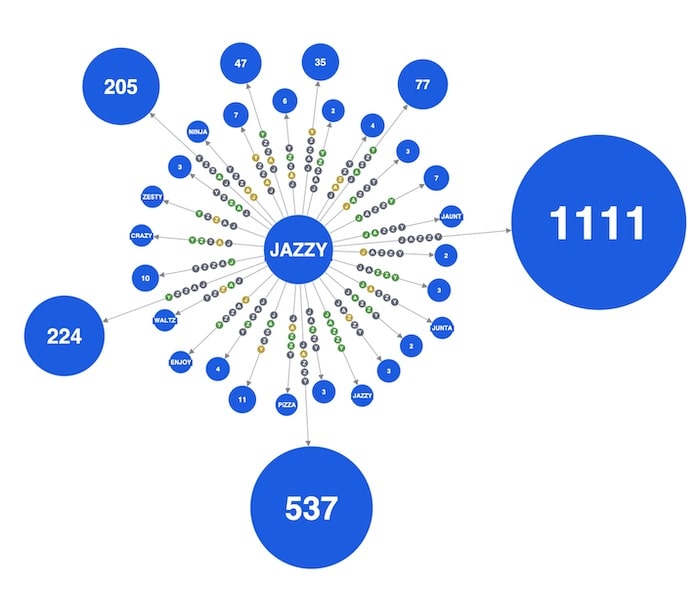
The node at the center displays the starter word, and the string of green, yellow and gray nodes on each link shows all the possible color combinations Wordle might return.
So for “Jazzy”, if we strike out completely with no correct letters, that leaves us with 1111 possible alternatives.
In fact, my program calculated that it’s the worst word you could try. The chart makes that obvious because I’ve told it to automatically make nodes larger, the higher the number they contain. Big nodes=bad.
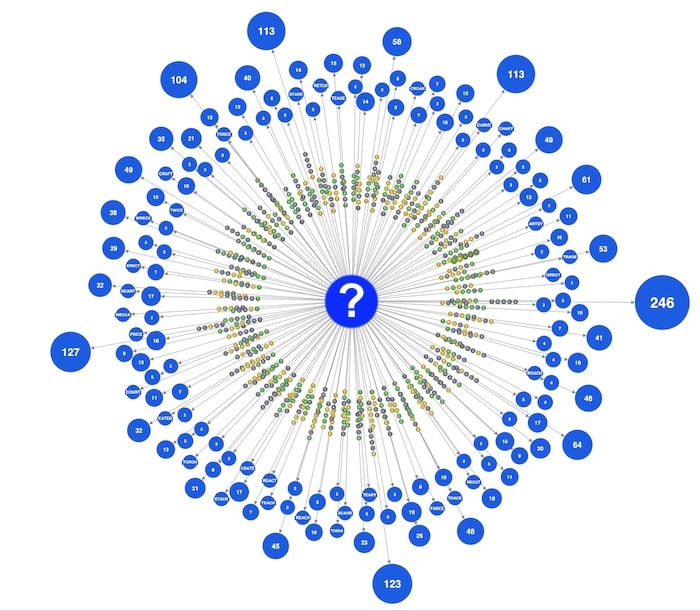
If you compare it to the graph for the “best” word (pictured below), you’ll see several smaller nodes – which shows that it narrows the options down much more efficiently.

Where the starter word narrows the possible solution down to a single word, you’ll see that word on the chart.
I’ve hidden it in case you want to avoid spoilers, but you can click below to see the word that will statistically get you off to the best start when tackling a new Wordle puzzle.
This visualization could stretch further if I develop the program to calculate the best word for each step towards the solution. KeyLines could even show you a connected network of the shortest routes from several starter words to a solution, in a single chart – we’re good with big data. If you fancy giving that a whirl, sign up for a free trial of KeyLines.