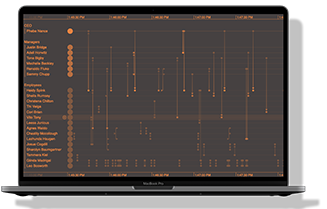
We recently released new feature-rich versions of KronoGraph, our timeline visualization toolkit. Our latest updates include a demo to help financial analysts follow the money and advanced options for customizing heatmaps.
KronoGraph 1.10: New Money Flow demo
If you work in financial fraud, cyber security or cryptocurrency, you need to try out our new interactive Money Flow demo. It shows how you can count on our timeline analysis tools to save money, time and reputation by tackling fraud head-on.
The demo visualizes financial data and flags suspicious transactions in a hybrid timeline and network visualization application. Check out other flow analysis use cases.
You can interact with the connected timeline and graph components to explore a possible money laundering operation. The timeline shows the sequence of each transaction to see how events unfold, and the chart maps out the net cash flow to understand connections.
Have you tried the Money Flow demo already? Let us know what you think!
KronoGraph 1.11: Cut to the chase by customizing your heatmap
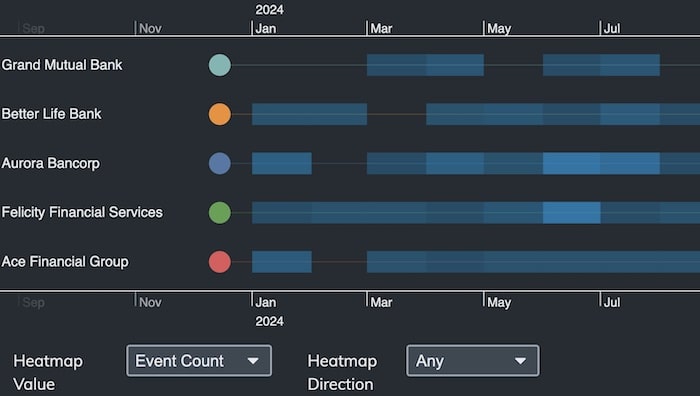
Heatmaps are a great way to aggregate multiple events in a timeline. You can now customize your heatmaps by choosing the value you want to measure, and the event directions you’re interested in.
In this example you can choose to visualize the number of transactions, or the amount of money exchanged, depending on what insights you want to reveal. You can also focus on payments made, payments received or both.

KronoGraph 1.11: annotating with precision
The new KronoGraph annotation function can highlight any entity or event that’s important to your investigation – such as a specific person, phone call or bank transaction. You can also use the function to add commentary, for the benefit of anyone who’s collaborating on your project.
Ready to visualize your time-based data?
If you like what you see, and you’re not already using KronoGraph, you can try our timeline analysis toolkit out for free.


