
In this blog post, we look at how industries use our powerful toolkits to build the data flow visualization tools their users rely on.
Most of the connected data we work with involves a soup of individual transactions, from financial payments to telephone calls. But another level of understanding emerges when you combine these transactions into a bigger picture – understanding the overall flow between participants. That flow could represent funds, data, commodities, information and more.
You can use data flow visualization in many use cases, and we’ve included examples from financial fraud investigations, cyber security and cryptocurrency to demonstrate this.
What do we mean by flow?
Think of flow as a summary of the net movement of a quantity, formed by aggregating transactions, sources and destinations in a way that tells you something useful about the system in question. For example, a net flow of ten million dollars between the accounts owned by Company X and offshore banks.
Flows aren’t the same as transactions. A transaction is an individual, atomic event connecting a source to a destination. For example, a single bank transfer between an account owned by Company X and an offshore bank account.
So why is it so important to understand flow? Let’s look at some popular use cases.
Data flow analysis: a crucial investigative technique
Investigators across many domains use event, activity and commodity flow analysis to establish behavioral patterns. For example:
- tracking the proceeds of crime
- identifying money laundering activity
- tracking cryptocurrency payments and transactions
- tracking the spread of something across a population, such as a rumor or a virus
- understanding criminal activity by tracking the paths taken by illegal movement of people, drugs or arms
- modeling a cyber attack based on its path through an IT infrastructure
So how do we represent flow in a way that investigators and analysts can understand? There’s a well-established visualization style you may be familiar with already…
The Sankey solution
Visualizing flow is not a new problem. One of the most famous visualizations is named after M. H. Sankey, who first used it to represent the thermal behavior of steam engines in 1898. These days you can find Sankey diagrams representing anything from supply chain and commodity movements to the shifting political allegiances of voters.
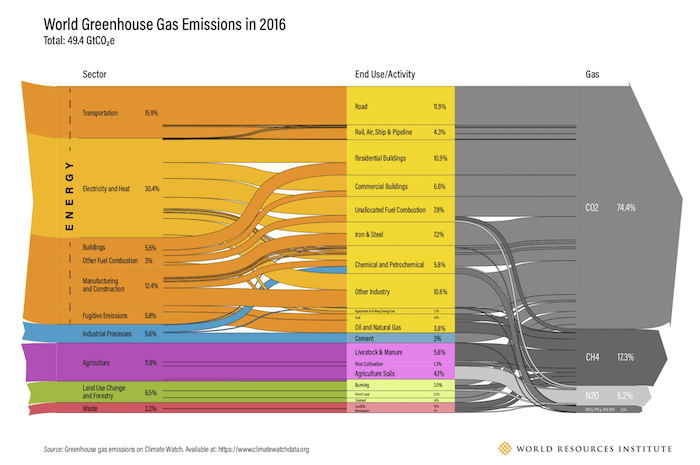
The trouble with a Sankey diagram is its scalability. There are three parts to it which can scale: the number of entities or actors in the diagram; the number of connections or flows between actors; and the number of stages in the flow you want to depict. All three of these need to be kept relatively small in order to get a useful visualization that the human eye can track and follow.
If we’re looking at flows such as bank transfers or cryptocurrency transactions, it’s extremely difficult to keep the size of these three numbers down to something manageable. This is where graphs and timelines come into play.
Graph visualizations and flow
To show the idea, I built a simple money flow application using our graph visualization toolkit, KeyLines, and a fictional dataset of bank transfers.
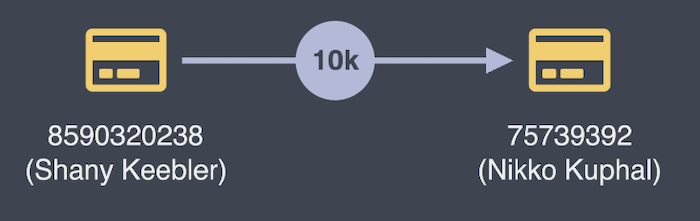
There are many ways to custom style items to suit your use case, but in my visual model:
- bank accounts are shown as credit card shaped nodes
- transactions are represented as links, with the total amount shown in a glyph on that link
- nodes are labelled with the unique account number plus the account holder’s name
Here’s what a transaction of $10,000 from one bank account to another looks like:
This is all well and good, but the model as it stands is flawed. Look at what happens when I add more bank transfers:
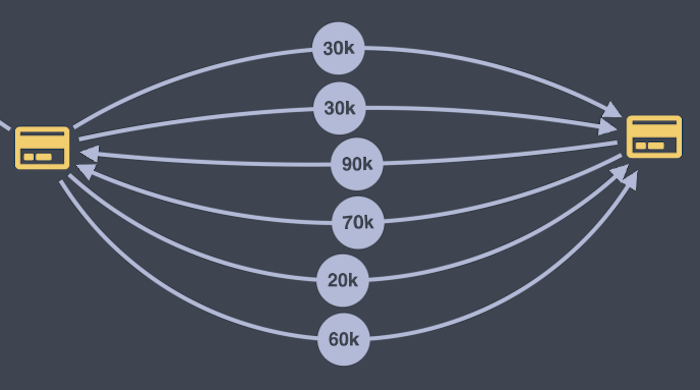
These links show a series of transactions, not a summary of money flow.
We can solve this problem by adapting our visual model so that each link shows only the net flow between two nodes. But it’s not just the links which benefit from aggregation. Zooming out a little, we can see that the four circled accounts belong to the same company. A simple model of one node per account does not reveal the true nature of the flow in and out of this company.
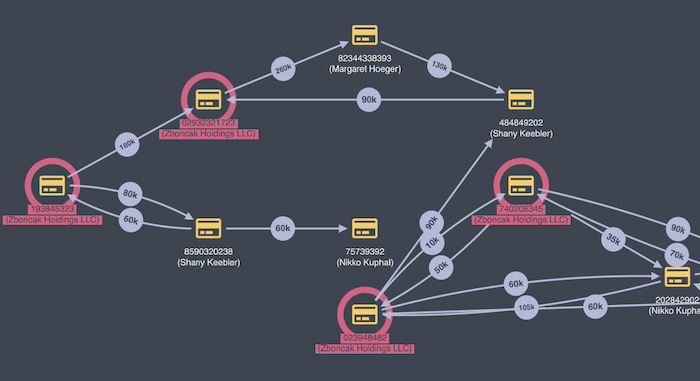
Again, we can solve this problem through aggregation. The animation below shows an analyst switching between three views – raw transactions, aggregated links, and aggregated nodes. As we aggregate, a progressively clearer picture of the overall flow emerges:
Adding the time dimension
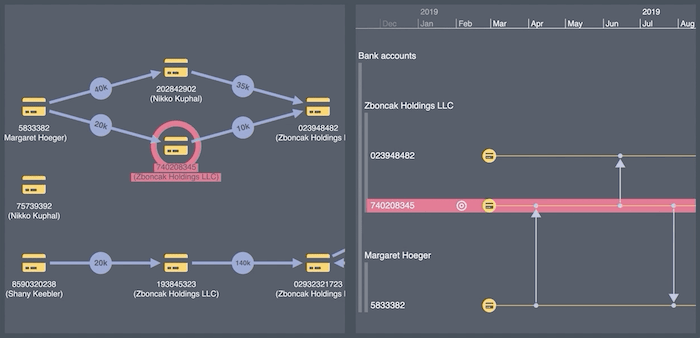
Graphs are far more scalable than Sankey diagrams, but the story doesn’t end here. Consider this view from my demo application:
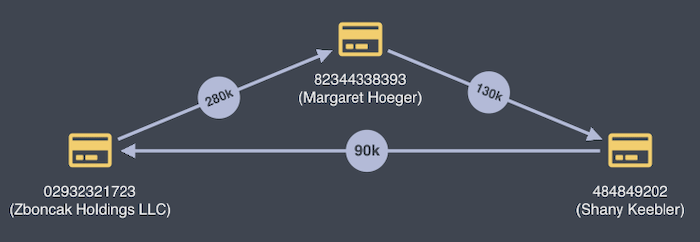
We can see a circular flow of funds between three entities, but in what order did these transactions happen? By aggregating transactions together, we’ve lost the crucial element of time.
This is where our KronoGraph toolkit comes in – it allows you to add an interactive timeline view to complement a graph visualization.
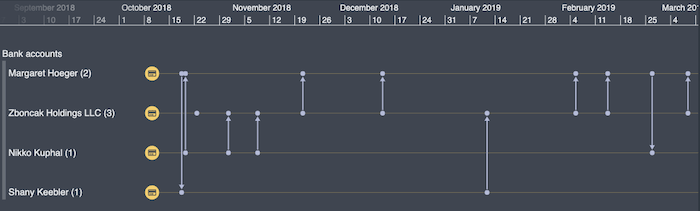
While the graph shows aggregated flows, loading individual transactions into KronoGraph shows the true sequence of events behind the graph.
In my data flow visualization, I’ve asked KronoGraph to display individual transactions, but to aggregate the bank accounts together to match the graph. Here’s a short period of activity between 7 bank accounts, aggregated into four ‘account holders’.
By combining both views side by side, we can create a powerful interactive graph and timeline visualization tool. For details on how to do this, see Integrating KronoGraph with KeyLines.
I can easily pan and zoom around the time range and see the net flow between parties in that period…
…or I can focus on an individual from my flow graph and pull out their transactions:
Summarizing flow on timelines
KronoGraph works well at any scale and no matter how many transactions you load into it. As the transaction volume increases, it intelligently adapts the view to show a useful representation of the data.
This cybersecurity application shows the flow of 740 IP packets between 40 different devices over a 15 second period:
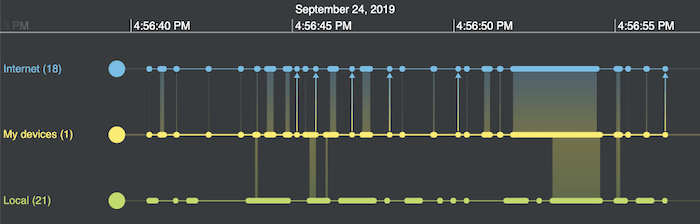
By aggregating devices into three distinct groups, and aggregating individual network transactions into broad ‘bands’ of activity where there’s not enough room to show detail, we get a digestible, bird’s eye view of what’s happening.
Cryptocurrency flows – the ultimate visualization test?
There’s no better example of a system that makes aggregation of transactions into flows more difficult than cryptocurrency blockchains. A Bitcoin transaction, for example, has multiple inputs and outputs, typically between addresses that are never re-used.
The solution to this problem deserves its own blog post (coming soon!), but here’s a sneak preview of how well KronoGraph handles a portion of the Bitcoin blockchain:
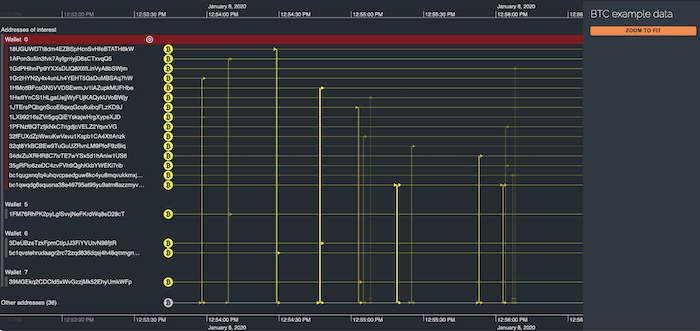
We’ve aggregated addresses of interest into a portfolio of wallets. The remaining blockchain is consolidated into a single row at the bottom, so that we can focus on transactions where Bitcoin has flowed from one wallet to another. Combining this view with a graph of the overall money flow gives you the best of both worlds – individual transactions and net flow, without overwhelming the user.
Create your own data flow visualization analysis application
Whether it’s aggregating bank transactions into net flows, or aggregating cryptocurrency addresses into wallets with known associations to hacker groups or the Dark Web, the battle is the same. Good analytical tools must convert transactions into flows using aggregation and smart visual modeling.
If you’ve got transactional data, we’ve got the toolkits to help you explore flows. Request a free trial.
Share:
