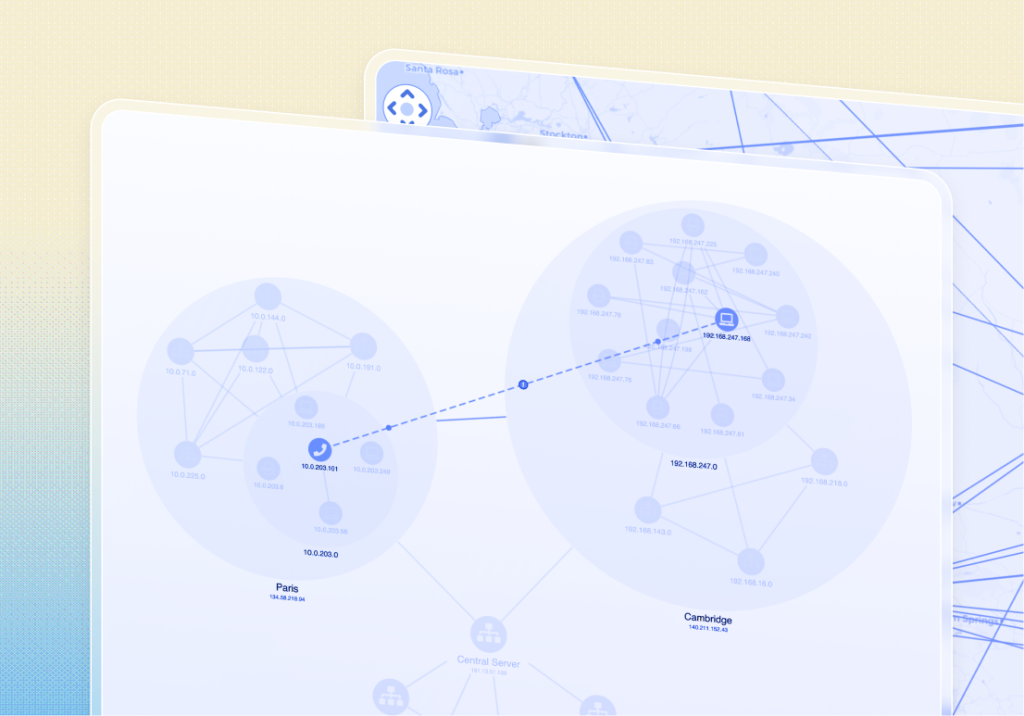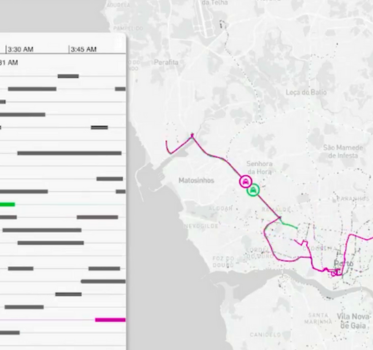

A phone call between two suspects. Two journeys across a city. Two devices detected near the same location.
Coincidence? Perhaps. But there’s more to this story than any one of those records can tell us.
In a criminal investigation, uncovering these connections is rarely straightforward. Investigators must piece together communications, events, and location data, often from different sources, to understand what happened and identify activity worth examining more closely.
Our Data Fusion Investigations showcase explores exactly that. Using a lawful intercept scenario, we demonstrate how KeyLines, KronoGraph, and MapWeave bring graph, timeline, and geospatial analysis together, helping investigators connect the clues and build a clearer picture of potential criminal activity.
What is lawful intercept?
Lawful intercept is the legally authorized monitoring and collection of communications by law enforcement and intelligence agencies. Depending on the authorization, this can include phone calls, messages, and associated metadata.
It’s an important capability in criminal investigations, helping agencies uncover connections between suspects and piece together sequences of events.
A single investigation may involve thousands of communications between multiple individuals, alongside records of their movements. Making sense of this interconnected data means understanding not only who’s communicating, but when and where activity takes place.
The challenge: Connecting the evidence
Three types of data are particularly useful when investigating these connections.
Communications data
Communication records provide information about interactions between individuals, including phone calls, text messages, and other forms of electronic communications.
For example, call detail records (CDRs) can contain caller and recipient identifiers, timestamps, and call durations.
These records can be used to establish communication networks, identify frequently contacted individuals, and explore relationships between suspects.
Temporal and event data
Communications and location records also contain timestamps that establish when activities occurred.
These timestamps allow investigators to reconstruct sequences of events, identify periods of increased activity, and examine the timing of communications alongside recorded movements.
Location and movement data
Location information, where legally available, provides geographical context to an investigation.
This may include cell tower connections, device location observations, or other geospatial records.
Did two individuals communicate shortly before traveling to the same location? Were their movements unusual? Could these events be related?
Answering those questions means exploring the relationships between different datasets, rather than examining each in isolation.
Why multi-modal visualization matters
Graph, timeline, and geospatial visualizations each offer a different perspective on an investigation, helping analysts understand relationships, trace events over time, and explore the geographic context.
In a connected application, selecting an individual in a graph can reveal their associated communications and movements. Investigators can then narrow the timeline to examine a particular period, while the map displays the corresponding geographic activity.
Our Data Fusion Investigations showcase demonstrates how developers can build this experience using three complementary SDKs.
Connecting graph, timeline, and geospatial analysis
KeyLines: Understanding who is involved
In many lawful intercept investigations, the communication network is a natural starting point. Investigators need to establish who’s connected, how frequently individuals communicate, and which relationships deserve closer attention.
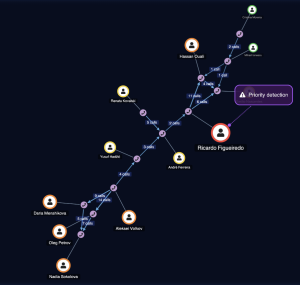
KeyLines visualizes this information as an interactive graph. Individuals and devices appear as nodes, with links representing their connections.
In our showcase, communication records are aggregated to show call volumes without cluttering the graph. Annotations highlight individuals flagged as higher priority in the underlying data, giving investigators a clear place to begin their analysis.
We’ve chosen KeyLines as the primary interaction point for the showcase. By selecting an individual or connection in the graph, investigators can explore the corresponding activity in KronoGraph and MapWeave.
KronoGraph: Understanding when events happen
The timing of communications can reveal patterns that aren’t immediately apparent from the network alone.
Did two individuals communicate shortly before a significant event? Was there an unusual increase in activity? Did their movements change after a particular interaction?
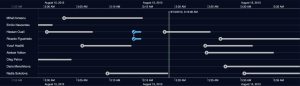
KronoGraph helps investigators answer these questions by visualizing communications and movement events chronologically.
Lawful intercept investigations can involve hundreds of thousands or even millions of recorded events, making it difficult to identify unusual activity within large datasets.
KronoGraph’s heatmap mode provides an aggregated overview, helping investigators identify periods of increased activity, recognize recurring patterns, and spot potential outliers.
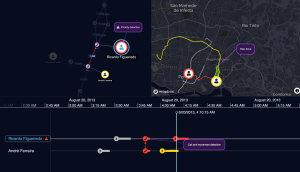
Investigators can then zoom into a specific period to examine individual calls and movements, with KronoGraph’s reveal functionality bringing relevant events into focus. In our showcase, highlighted events draw attention to phone calls followed by movement detections, allowing investigators to explore possible connections between them.
As the visible timeframe narrows, individuals without activity during that period are filtered out, reducing the amount of information displayed. Investigators can move from a dense overview of events to a focused investigation involving just a handful of individuals.
MapWeave: Understanding where activity takes place
Location data can help investigators understand how recorded movements relate to communications and other events.
A communication network might reveal frequent contact between two suspects. But have their recorded movements ever brought them to the same location?
MapWeave enables developers to add interactive geospatial analysis to investigative applications.
Individual location observations can be displayed as points on a map, helping investigators identify areas of concentrated activity. Sequential observations can also be connected to visualize movement trajectories, with tracker nodes showing a device’s estimated position along a route at a selected point in time.
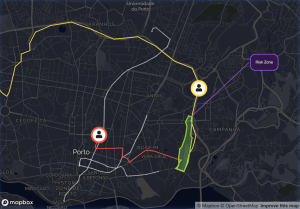
MapWeave also supports GeoJSON layers, allowing developers to highlight geographic boundaries and areas of interest. In our showcase, a high-risk zone surrounds a train station, helping investigators identify when recorded movements intersect that area.
The map is synchronized with KronoGraph. As investigators navigate the timeline, the location observations displayed on the map are filtered to the selected timeframe. Tracker nodes also move along their trajectories in relation to the timeline’s reference point.
This allows investigators to examine recorded movements alongside communications and other events, without having to analyze the datasets separately.
See data fusion investigations in action
Watch our video walkthrough to see how KeyLines, KronoGraph, and MapWeave work together in a lawful intercept investigation.
Following a lead across three dimensions
In our showcase, KeyLines highlights a high-priority suspect and reveals a series of communications with another individual. Selecting their connection brings the relevant calls into focus on KronoGraph’s timeline.
Shortly after the phone call, movement events are recorded for both devices.
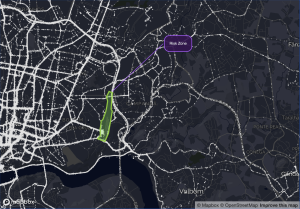
The investigator explores the timeline further, watching the corresponding movement trajectories unfold on MapWeave. The trajectories show both devices moving across the city and converging near a train station identified as a high-risk zone.
On their own, these events might have perfectly ordinary explanations. A phone call doesn’t establish criminal activity, and neither does traveling through a particular area.
But their timing and proximity raise questions worth investigating. Could the phone call and their subsequent movements be connected?
By bringing the communication network, timeline, and location data together, the application helps investigators identify these connections and examine their significance.
The evidence may not provide an immediate answer. But it gives investigators a clearer picture of the activity and a lead worth exploring further.
From separate records to connected intelligence
Our Data Fusion Investigations showcase demonstrates how developers can bring graph, timeline, and geospatial analysis together in a single investigative application.
With KeyLines, KronoGraph, and MapWeave, developers can give investigators the freedom to explore connected evidence on their own terms, following leads wherever the data takes them.
Ready to explore data fusion for yourself?
Explore our Data Fusion Investigations showcase to see how the three SDKs work together.
Build richer investigation applications
Request a trial and evaluate our graph, timeline and geospatial SDKs with full access and support.