
We asked a custom AI agent to find known financial crimes in a Neo4j dataset based on transaction data published by the International Consortium of Investigative Journalists (ICIJ) as part of its FinCEN Files investigation.
It claimed to find a pattern resembling the Russian Laundromat, a money-laundering scheme that moved billions of dollars through banks in Russia, Latvia, and Moldova.
But the question is, does the evidence support the claim?
Financial investigations rarely rely on a single analytical view. Analysts need to understand who is involved, when activity occurred, and where money moved before a pattern can be assessed as suspicious. An AI’s answer can point to a pattern, but it can’t show analysts the who, when, and where behind it. And if you’re building products where AI surfaces answers, that’s exactly what your users will need.
So, while AI may have found the lead, we must find the evidence.
The AI’s hypothesis was specific:
“The data appears to contain a Russian Laundromat-style pattern centered on Russia, Latvia, and Moldova. Activity is concentrated around a relatively small number of intermediary banks, with distinct periods of high-frequency transfers, unusually large transactions, and potential round-trip movements between jurisdictions.”
This gives us five questions to answer:
- Is there really a dominant Russia-Latvia-Moldova corridor of transactions?
- Are particular banks acting as hubs?
- Does the behavior change over time?
- Do unusually large transfers cluster within particular periods?
- Can we find evidence of money moving between different regions and subsequently returning?
To find out, we’ll examine the evidence using two Cambridge Intelligence SDKs, both working from the same Neo4j data. KronoGraph shows the when: each transfer that happened and in what order. MapWeave shows the where: where the money went and which banks connect the flows.
Once the investigation is complete, we’ll also walk through how we built it, from the custom AI agent to keeping both views in sync. Jump to any section below:
- The investigation
- What did the investigation reveal?
- How we built the investigation
- From hypothesis to evidence
The investigation
We’ll investigate the AI-generated hypothesis through a six-step interactive story, beginning with the wider Russia-Latvia-Moldova network before narrowing our focus to individual banks, periods, and transactions.
Together, KronoGraph’s timeline and MapWeave’s map let us, as “analysts”, examine the same evidence across time and geography. As we change the timeframe, entities, or focus in one stage of the story, both views update to keep the evidence aligned. And the visualization stays fully interactive throughout, so you can step off the guided story at any point and inspect the evidence for yourself.
Step 1: Is the pattern really there?
First, we need to establish whether a Russian Laundromat-style pattern is present in the underlying FinCEN Files dataset.
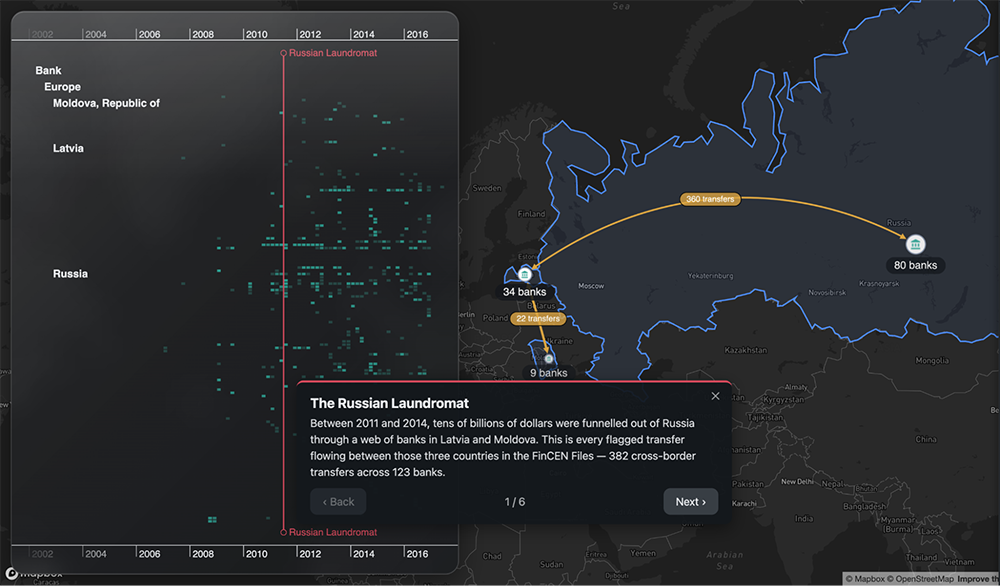
We begin in KronoGraph by adding a marker for the Russian Laundromat, placing the activity we’re investigating alongside its historical context. Grouping entities by country then makes it much easier to compare activity across Russia, Latvia, and Moldova throughout the relevant period.
MapWeave reveals the scale of the network behind that activity: 123 banks, plus hundreds of transactions across the three countries.
To reduce visual clutter, MapWeave’s proximity combine mode groups geographically close nodes and their links, with each node labeled and sized by the number of banks it represents. Links are treated in the same way, summarizing the number of transactions between locations.
We can make the pattern even easier to interpret through styling. Bank icons make the combined nodes recognizable, arrows communicate the direction of each flow, and the GeoJSON layer outlines each country.
Together, these features turn a dense network into a clear overview of the activity across Russia, Latvia, and Moldova during the relevant period. This gives us a basis for asking more specific questions about the banks, transactions, and changes in behavior within the network.
The investigation has now moved beyond an AI-generated lead: we can inspect the underlying activity directly.
Step 1: Establishing the investigation
Step 2: Following the money from LTB Bank
With the wider pattern established, we can begin following the money chronologically.
Latvia’s LTB Bank is associated with 91 transfers totaling approximately $312 million during the earlier period of activity.
Using KronoGraph’s focus mode, we can isolate LTB Bank and its connected entities, remove unrelated activity, and expose the banks with which transactions occurred. The timeline shows multiple transfers distributed across numerous Russian banks throughout 2011-2012.
Several transactions occur at similar points in time, causing events to overlap. KronoGraph’s event fold separates and labels these transactions and their values, with arrows showing the direction the money was moved. This allows us to inspect each transaction in turn.
Approximately $311.4 million of the identified value is associated with Russian banks, compared with ~$497,000 involving two banks in Moldova. With MapWeave, scaling link width by transaction value makes this imbalance visible at a glance.
The result is a more specific picture of the earlier activity: although the wider network includes Russia, Latvia, and Moldova, the identified transaction value associated with LTB Bank is overwhelmingly connected to Russian banks.
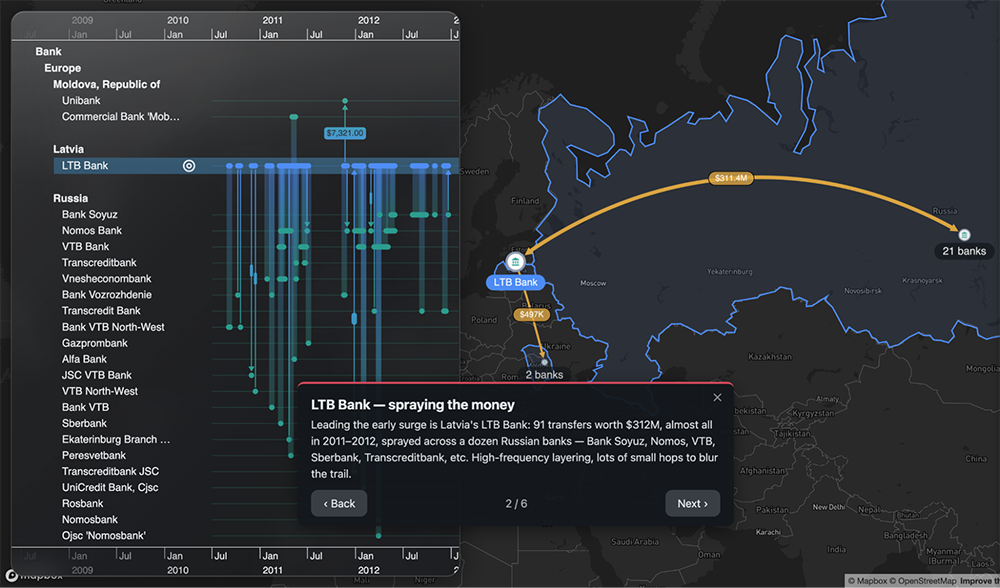
Step 2: LTB Bank spraying the money
Step 3: The pattern shifts
Moving forward through the timeline reveals a significant change in the pattern of activity. Compared with LTB Bank, AS Expobank is associated with fewer transactions and fewer banks, but a significantly greater value is being transferred.
Focusing on AS Expobank in KronoGraph isolates this activity and reveals a more concentrated network of Russian banks, with the identified transactions now flowing predominantly in one direction: into Russia.
Again, scaling the links with MapWeave makes the change in transaction value immediately obvious. Approximately $1.6 billion flows between AS Expobank and 11 Russian banks, compared with roughly $312 million associated with LTB Bank in the previous step.
The transaction pattern changes: fewer transactions, fewer banks, and substantially higher transaction values.
This matters because the data is not showing one consistent pattern throughout the period. The institutions involved and the scale and frequency of transactions change over time, giving us another part of the AI’s hypothesis to investigate.
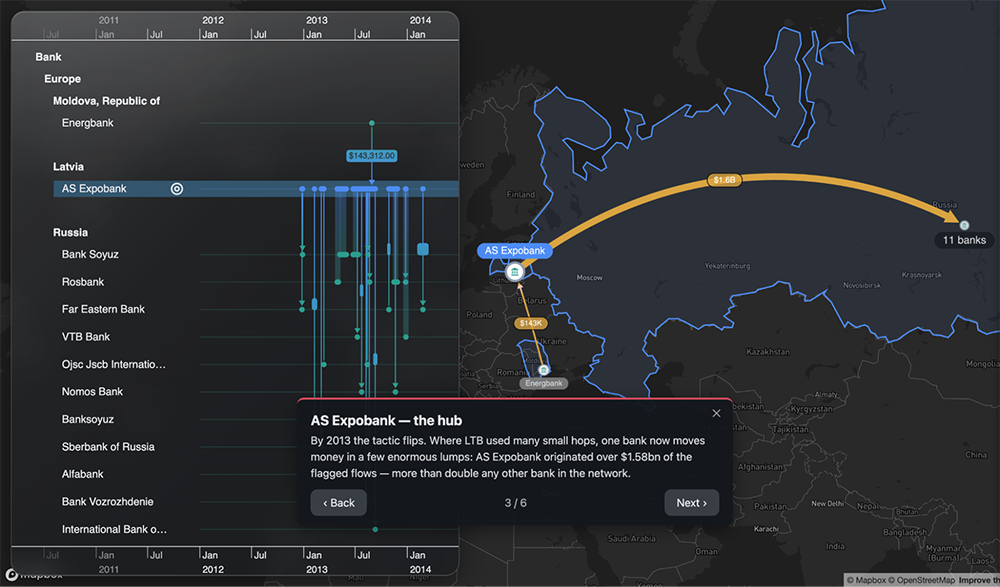
Step 3: AS Expobank as the hub
Step 4: Investigating the large transactions
Diving deeper into AS Expobank’s activity, three unusually large transactions stand out during May 2013. Using KronoGraph’s range API, we can narrow the timeline to this specific period and investigate them in more detail.
Adding annotations makes the transactions immediately identifiable, revealing two transfers to Bank Soyuz worth approximately $304 million and $266 million, alongside a $300 million transfer to Rigensis Bank. KronoGraph’s event fold separates transactions occurring at the same time, allowing overlapping events to be inspected individually.
These transactions turn the broader change identified in Step 3 into specific events: three large transfers concentrated within a single month, involving named banks.
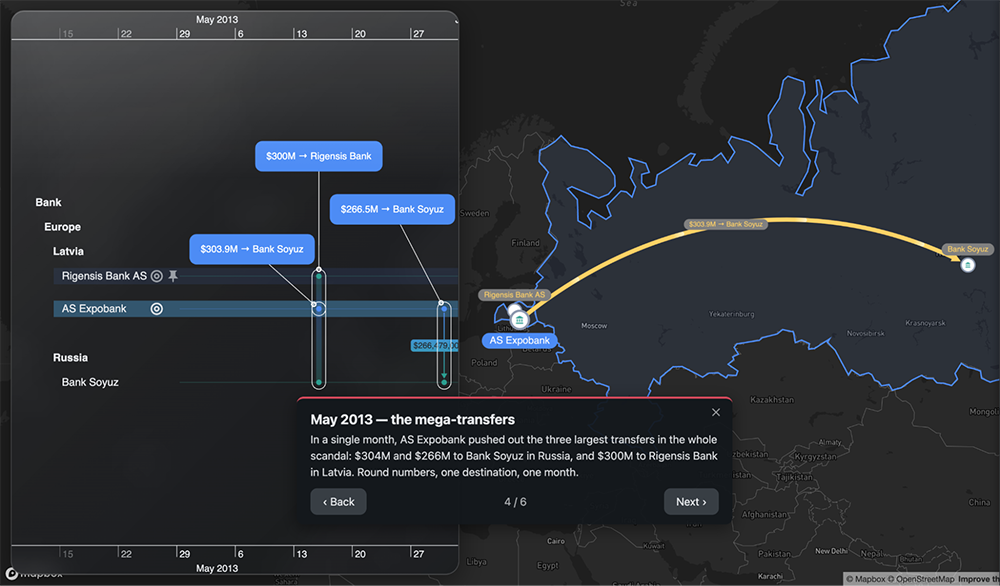
Step 4: The mega-transfers
As the timeframe narrows, MapWeave updates alongside KronoGraph. Here, we introduce a flow animation to draw attention to the direction and scale of the transfers between Latvia and Russia.

The flow animation in MapWeave
Step 5: Money in vs money out
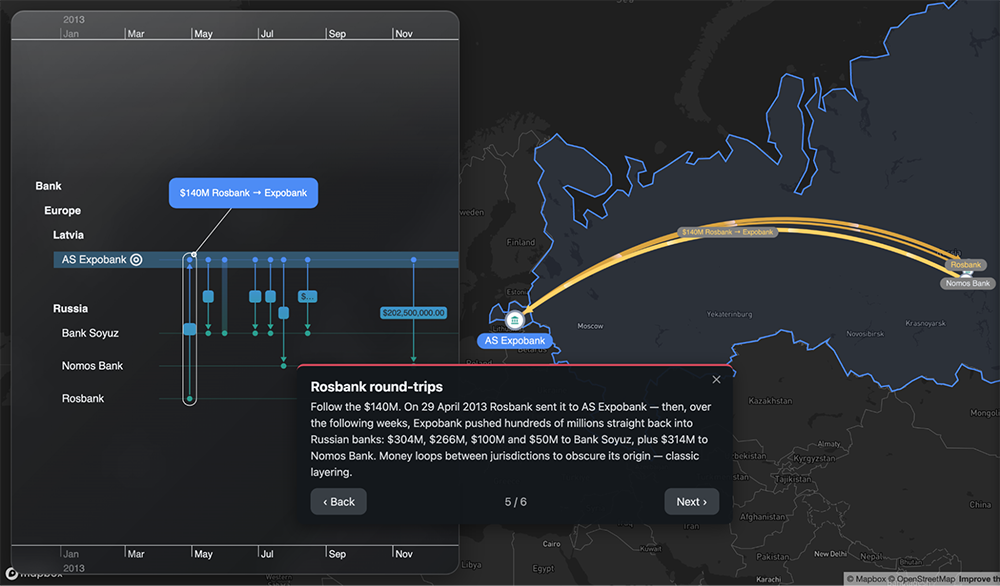
Just before those large transfers identified in the previous step, there is another interesting pattern. On April 29, 2013, Rosbank sent $140 million from Russia to AS Expobank in Latvia. In the weeks that followed, substantially larger sums flowed from AS Expobank back into Russian banks.
KronoGraph allows us to place these transactions in sequence, making it clear that the initial $140 million transfer occurred before the large outbound transactions investigated in Step 4.
For this stage, MapWeave provides a particularly useful view. Displaying the transactions as individual links and applying the flow animation allows us to visually follow the movement of money from Russia into Latvia and then back towards multiple Russian banks.
Step 5: Rosbank round-trips
Step 6: The full picture
After examining individual banks, transactions, and periods, the wider view lets us check whether those observations still fit the broader dataset.
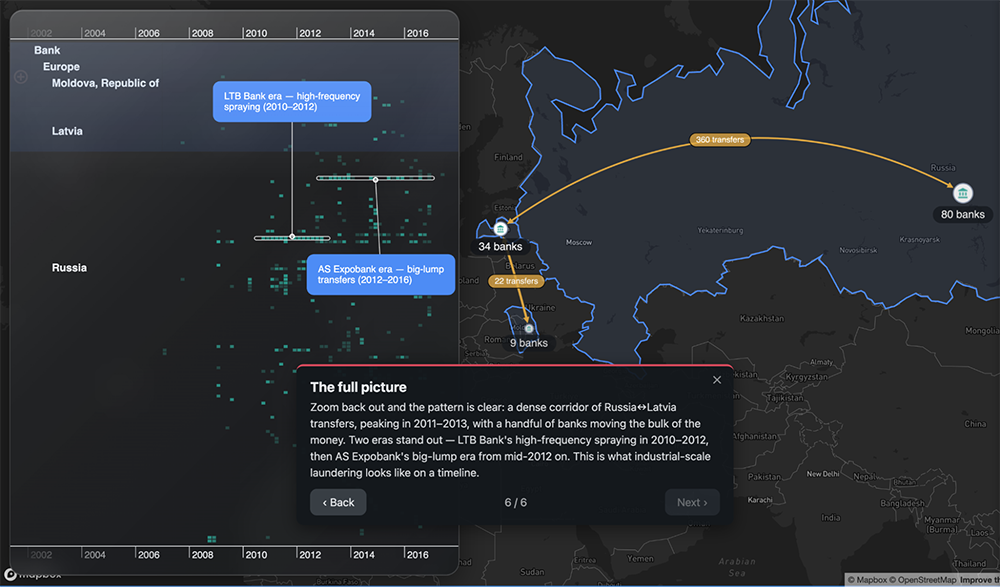
KronoGraph’s heatmap makes the change in activity particularly clear. The earlier LTB Bank period shows a higher frequency of smaller transactions, while from 2012 onwards we begin to see the larger, lower-frequency transfers associated with AS Expobank. Using annotations, we can highlight these periods directly on the timeline and make the change easier to identify within the wider dataset.
In MapWeave, we can zoom back out and combine the network at country level. This provides the geographical summary of the same activity, showing 360 transactions between Latvia and Russia, alongside further activity involving Moldova.
Step 6: The full picture
What did the investigation reveal?
So, does the evidence back up the AI’s hypothesis? Let’s revisit our five questions:
- Is there a dominant Russia-Latvia-Moldova corridor of transactions?
The wider network showed substantial activity between Russia and Latvia, with additional activity involving Moldova. - Are particular banks acting as hubs?
Latvian banks such as LTB Bank and AS Expobank emerged as key intermediaries. - Does the behavior change over time?
LTB Bank handled a higher frequency of smaller transfers during 2011-2012, while AS Expobank managed fewer but substantially larger transfers from 2012 onwards. - Do unusually large transfers cluster within particular periods?
In May 2013, three large transfers were made of approximately $304 million, $300 million, and $266 million. - Can we find evidence of money moving between different regions and subsequently returning?
A $140 million Rosbank transfer was made into AS Expobank, followed by substantially larger transfers from AS Expobank back towards Russian institutions.
The evidence is consistent with the AI’s hypothesis that the data contains a Russian Laundromat-style pattern. More importantly, the conclusions can be traced back to specific banks, transactions, dates, and values in the data.
The AI told us where to look. The visualization let us show the evidence.
How we built the investigation
Everything we explored is driven by the same underlying public FinCEN Files dataset. With the investigation complete, let’s look at how our custom AI agent and application were built, and how Neo4j, KronoGraph, and MapWeave were brought together to create it.
Creating our custom AI agent
We’ll first build and configure our custom AI agent to be able to parse and investigate our data. We’ll use VS Code with GitHub Copilot as our AI toolkit of choice, but you can follow the same steps with almost any AI platform that supports custom agents and instructions. Working within VS Code will also allow us to have the agent, the data and the code for the visualization all in one place.
The agent will be exploring the transformed KronoGraph and MapWeave data and not the original Neo4j data source. This is important, as we don’t want to throw the raw data into the agent. We want to use our transformed data for the agent, as it represents our visual and analytic model that takes the raw data and transforms it into something that’s better suited for both humans and AI agents. The transformed data will have already been run through a set of filters via a Cypher query to make it much more focused.
To start, we’ll use the /create-agent skill available in VS Code to easily set up our agent. The agent-creation prompt matters because it will set its capabilities, restrictions, and interactivity with the user.
/create-agent Analyse financial KronoGraph and MapWeave data that has both time and location elements. The agent will both understand the data, use the KronoGraph and MapWeave MCP servers to parse the data. Most importantly, analyse the data for suspected activity that correlates with major operations/events, past and ongoing, within the data's time span.

When analysing the data:
1. First, link observed patterns to documented events/sanctions/known financial activity
2. Flag anomalies, unusual timings, coordinated movements


Guardrails:
- Only analyse; don’t create any visualizations yet
- Let the user have input after each step of the analysis
We’ll store the custom agent in our repo under .github/agents/, which the creation skill will automatically do for us. This is similar to other AI harnesses and agentic platforms that will let you store the skill alongside your data and code.
With the agent in place, we asked it to identify known financial crime events that overlapped with the period covered by the data. It came back with several leads, including the Russian Laundromat. This lead stood out, with 464 KronoGraph events across 123 banks, more than twice as many as the next-largest scandal. From there, the agent generated the hypothesis we set out to test.
Connecting to Neo4j
To connect to our Neo4j instance, we’ll use the neo4j-driver-lite package. This provides everything needed to authenticate with Neo4j, establish a connection and execute Cypher queries. After installing it into our environment (npm install neo4j-driver-lite), we can store our connection details in the environment variables rather than hard-coding them into the application.
NEO4J_URI=neo4j+s://demo.neo4jlabs.com
NEO4J_USER=fincen
NEO4J_PASSWORD=fincen
NEO4J_DATABASE=fincen
Using these values, we can create a Neo4j driver that manages communication between our application and the database.
import neo4j from "neo4j-driver-lite";


const driver = neo4j.driver(
 NEO4J_URI,
 neo4j.auth.basic(NEO4J_USER, NEO4J_PASSWORD),
);
Before querying the database, we can verify that the connection has been established successfully. Calling driver.getServerInfo() confirms that the database is reachable and ready to accept queries.
export async function connect() {
 await driver.getServerInfo();
 console.log(
   `Connected to Neo4j at ${NEO4J_URI} (database: ${NEO4J_DATABASE})`,
 );
 return driver;
}
With the connection established, we can now retrieve data from the graph. We’ll create a reusable loadData helper that accepts a Cypher query and optional parameters, executes it within a Neo4j session, and returns the results as plain JavaScript objects.
Neo4j uses several custom data types, so we also make use of a toPlain() helper to convert these into standard JavaScript values before passing them to the visualization SDKs.
export async function loadData(cypher = "MATCH (n) RETURN n", params = {}) {
 const session = driver.session({ database: NEO4J_DATABASE });
 try {
   const result = await session.run(cypher, params);


   // Convert Neo4j records into plain JSON-serialisable objects.
   const data = result.records.map((record) => {
     const obj = {};
     for (const key of record.keys) {
       obj[key] = toPlain(record.get(key));
     }
     return obj;
   });


   return data;
 } finally {
   await session.close();
 }
}
Loading the data into KronoGraph
With our Neo4j connection established, we can now retrieve the data needed for the investigation and prepare it for KronoGraph.
The following Cypher query returns the financial transfers together with the entities, countries, locations, and dates associated with each transaction. As KronoGraph is designed to handle hundreds of thousands of events, we’ll retrieve the complete dataset without applying a limit.
const cypher = `
     MATCH (orig:Entity)<-[:ORIGINATOR]-(f:Filing)-[:BENEFITS]->(benef:Entity)
     OPTIONAL MATCH (orig)-[:COUNTRY]->(origCountry:Country)
     OPTIONAL MATCH (benef)-[:COUNTRY]->(benefCountry:Country)
     RETURN
       f.id            AS id,
       orig.name       AS from,
       orig.id         AS fromId,
       origCountry.name AS fromCountry,
       orig.location   AS fromLocation,
       benef.name      AS to,
       benef.id        AS toId,
       benefCountry.name AS toCountry,
       benef.location  AS toLocation,
       f.begin         AS start,
       f.end           AS end,
       f.amount        AS amount,
       f.filer_org_name AS filer,
       f.sar_id        AS sarId
     ORDER BY f.begin
     ${limit ? "LIMIT toInteger($limit)" : ""}
   `;
The query follows each financial transfer from its originating entity to its beneficiary, while also retrieving the country and geographical location associated with both sides of the transaction. This gives us everything required to investigate the activity from both a temporal and geographical perspective.
The next step is to transform the Neo4j results into the data model expected by KronoGraph. Each financial institution becomes a KronoGraph entity, while every transfer between two institutions becomes an event on the timeline.
Alongside the core data, we also attach additional metadata – including the transaction amount and country, to each entity and event. This metadata can later be used for filtering, grouping, annotations and styling throughout the investigation.
For this example, we’ll also assign a color to each country. This makes it much easier to distinguish activity as we progressively narrow the investigation.
export function transformToKronograph(transfers, options = {}) {
 const entities = {};
 const events = {};
 ...
}
With the transformation in place, the FinCEN Files graph is now ready to be visualized in KronoGraph.
Building the map view in MapWeave
Using the same Neo4j data, we’ll create a geographical view of the investigation. Banks are represented as nodes, transactions between them are shown as links, and a GeoJSON layer provides country boundaries to place the network into its geographical context.
 nodes[id] = {
   type: "node",
   latitude: centroid?.lat != null ? centroid.lat + j.dLat : undefined,
   longitude: centroid?.lng != null ? centroid.lng + j.dLng : undefined,
   size: 7,
   border: { color: NODE_BORDER_COLOR, width: 1.5 },
   image: { url: BANK_ICON_URL, color: BANK_ICON_COLOR, scale: 1.2 },
   label: { text: id, color: "#e8ecf1" },
   color: NODE_BG_COLOR,
   data: { country, continent: continentFor(country) },
 };
Introducing MapWeave
Synchronizing the investigation
With the same underlying data loaded into KronoGraph and MapWeave, the final step is to bring the two visualizations together as a single investigation. KronoGraph and MapWeave are designed to work seamlessly together, allowing temporal and geographical perspectives to become part of the same analytical experience rather than separate visualizations.
The six-step story is controlled by a simple HTML overlay. Each step defines the state required for that point in the investigation – including the visible timeframe, entities of interest and the way the data should be presented. Moving between steps applies those changes to both SDKs simultaneously, keeping KronoGraph and MapWeave aligned as the investigation progresses.
For example, when the investigation narrows to the three large transactions in May 2013, KronoGraph updates its range, focuses on the relevant banks and adds annotations to the events. At the same time, MapWeave updates the visible network and applies flow animation to the corresponding transactions.
const SCENES = [
 {
   title: "The Russian Laundromat",
   body: "Between 2011 and 2014, tens of billions of dollars were funnelled out of Russia through a web of banks in Latvia and Moldova. This is every flagged transfer flowing between those three countries in the FinCEN Files — 382 cross-border transfers across 123 banks.",
   focus: null,
   range: [new Date(2007, 0, 1), new Date(2017, 11, 31)],
 },
 {
   title: "LTB Bank — spraying the money",
   body: "Leading the early surge is Latvia's LTB Bank: 91 transfers worth $312M, almost all in 2011–2012, sprayed across a dozen Russian banks — Bank Soyuz, Nomos, VTB, Sberbank, Transcreditbank, etc. High-frequency layering, lots of small hops to blur the trail.",
   focus: ["LTB Bank"],
   range: [new Date(2010, 6, 1), new Date(2013, 0, 31)],
 },
 {
   title: "AS Expobank — the hub",
   body: "By 2013 the tactic flips. Where LTB used many small hops, one bank now moves money in a few enormous lumps: AS Expobank originated over $1.58bn of the flagged flows — more than double any other bank in the network.",
   focus: ["AS Expobank"],
   range: [new Date(2012, 0, 1), new Date(2014, 5, 30)],
 },
 {
   title: "May 2013 — the mega-transfers",
   body: "In a single month, AS Expobank pushed out the three largest transfers in the whole scandal: $304M and $266M to Bank Soyuz in Russia, and $300M to Rigensis Bank in Latvia. Round numbers, one destination, one month.",
   focus: ["AS Expobank"],
   range: [new Date(2013, 2, 1), new Date(2013, 11, 30)],
 },
 {
   title: "Rosbank round-trips",
   body: "Follow the $140M. On 29 April 2013 Rosbank sent it to AS Expobank — then, over the following weeks, Expobank pushed hundreds of millions straight back into Russian banks: $304M, $266M, $100M and $50M to Bank Soyuz, plus $314M to Nomos Bank. Money loops between jurisdictions to obscure its origin — classic layering.",
   focus: ["AS Expobank"],
   range: [new Date(2013, 3, 1), new Date(2013, 11, 31)],
 },
 {
   title: "The full picture",
   body: "Zoom back out and the pattern is clear: a dense corridor of Russia↔Latvia transfers, peaking in 2011–2013, with a handful of banks moving the bulk of the money. Two eras stand out — LTB Bank's high-frequency spraying in 2010–2012, then AS Expobank's big-lump era from mid-2012 on. This is what industrial-scale laundering looks like on a timeline.",
   focus: null,
   range: [new Date(2007, 0, 1), new Date(2017, 11, 31)],
 },
];
This pattern isn’t limited to financial investigations. Because KronoGraph and MapWeave are complementary SDKs designed to work together, the surrounding experience can be designed around the analytical workflow itself. Story controls, external UI, filters or other application logic can all drive the visualizations as required.
In our example, this means the investigation can move easily from a high-level network involving hundreds of banks, through specific institutions and transactions, and back out again – with KronoGraph and MapWeave working together throughout to maintain a consistent view of the investigation.
From hypothesis to evidence
The technical build shows how an AI agent can surface a potential pattern and how an application can bring the relevant data into view. But the real test is what happens when we examine the AI’s findings against the evidence.
In this investigation, AI helped determine where to look, identifying a Russian-Laundromat-style pattern. But KronoGraph and MapWeave provided the environment in which those ideas could be tested against the underlying evidence: moving between years and individual transactions, isolating entities, comparing behaviors, following geographical flows, and reconstructing sequences of activity.
Those capabilities matter, regardless of where the original hypothesis comes from. An analyst might discover it manually, a detection system might flag it, or an AI model might surface it. In every case, someone still needs to understand why the pattern exists and determine whether the evidence actually supports it.
The SDKs also allow that analytical process to become part of the output. By synchronizing KronoGraph and MapWeave with an interactive story, the investigation can be replayed rather than simply summarized in a report document. Another analyst can follow the same evidence, inspect the underlying transactions, and challenge the conclusions for themselves.
As AI makes finding potential patterns faster, the ability to investigate, validate, and explain those patterns becomes more important than ever.
Give your users a way to check what AI tells them. Request a trial of KronoGraph and MapWeave or explore more use cases.
Build richer investigation applications
Request a trial of KronoGraph and MapWeave to get started.
Share: