
Analysts and investigators are working with increasing volumes and diversity of data, driven by advances in monitoring hardware, AI-generated data and greater fusion of data from different sources. A key challenge across intelligence analysis is making sense of the signals and patterns across these complex datasets to support decision-making.
Visualize hundreds of thousands of time-based events
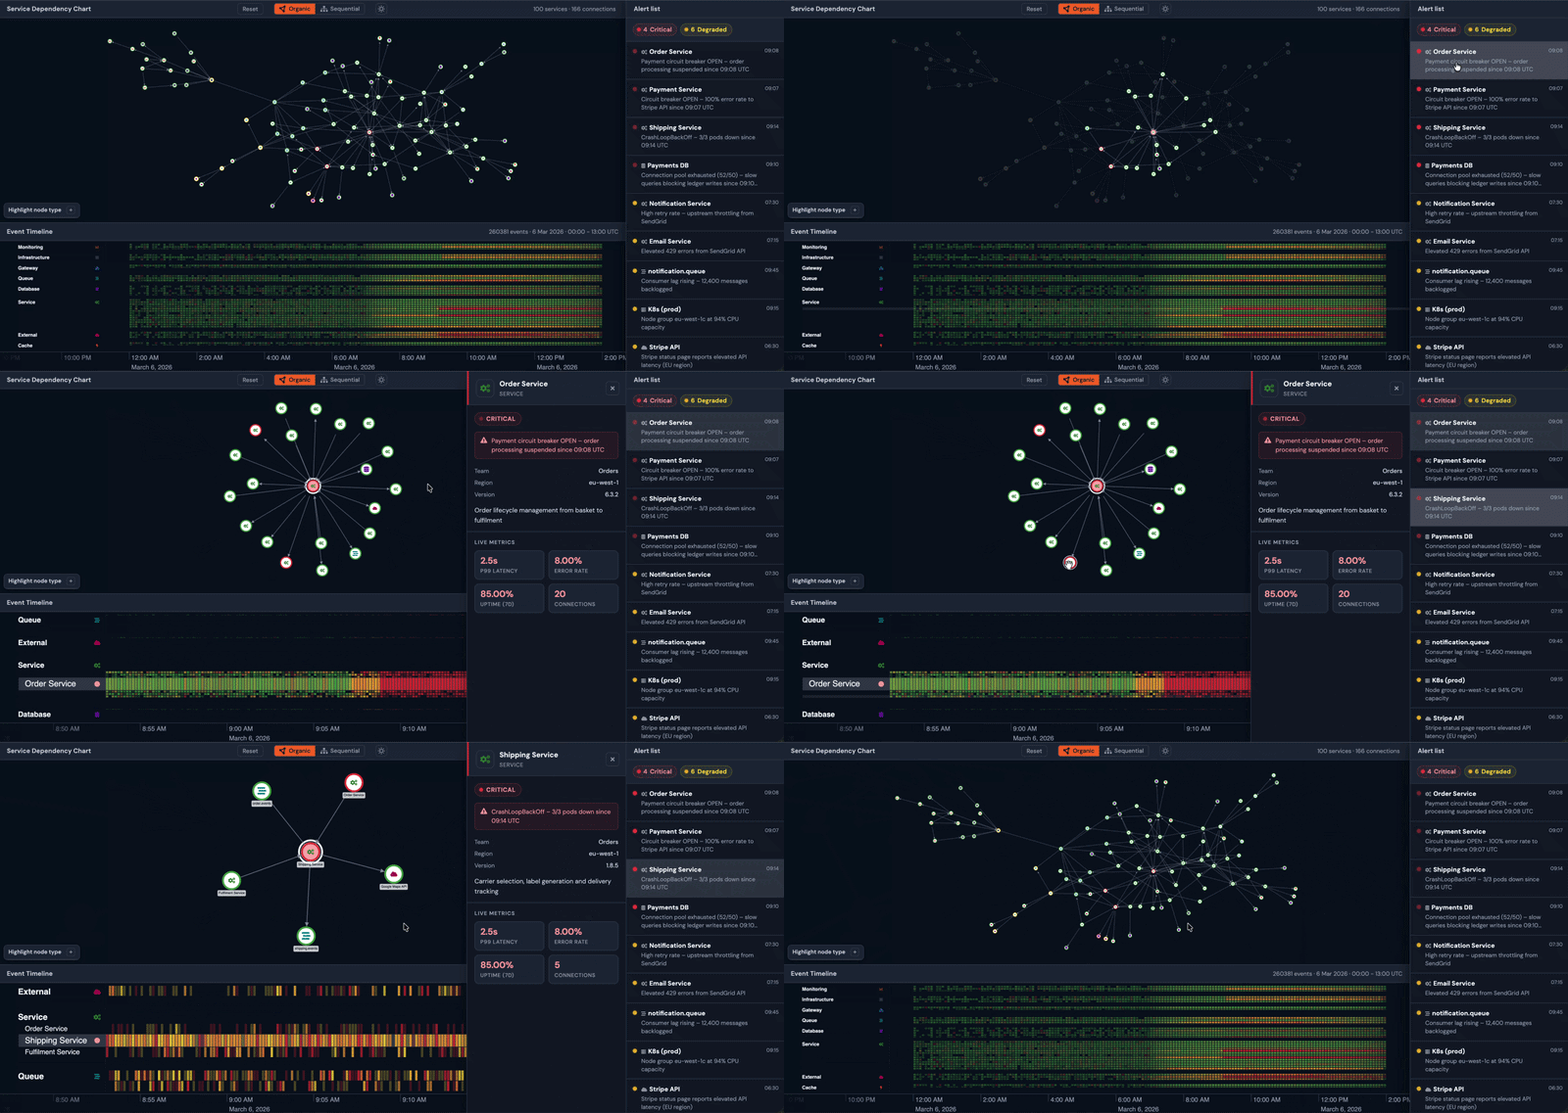
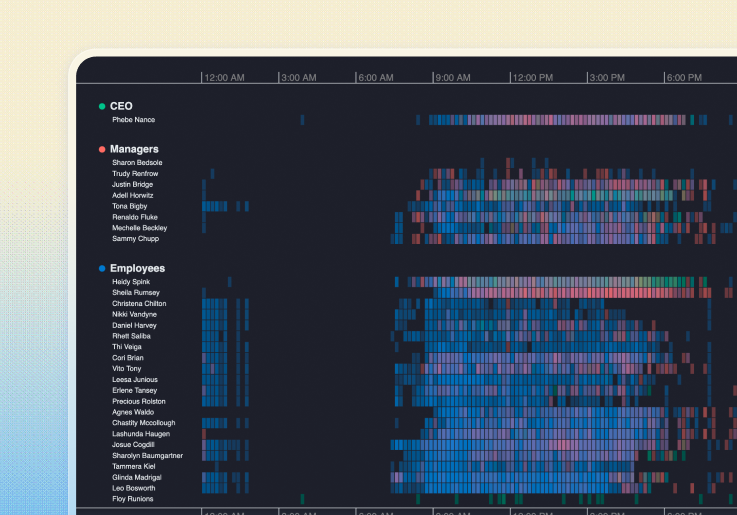
Performance at scale in the Cloud Monitoring showcase
With KronoGraph 4.0, we’ve focused on ensuring that developers can handle time-based data effectively at even greater scales.
KronoGraph can now handle hundreds of thousands of time-based events smoothly in the front end, allowing end users to zoom from the big-picture context down to individual events and back again. This means investigators can work with much larger, more complex datasets, while developers can create powerful applications for scenarios such as enterprise cloud monitoring and multi-domain intelligence investigations.
Build richer interactions at runtime
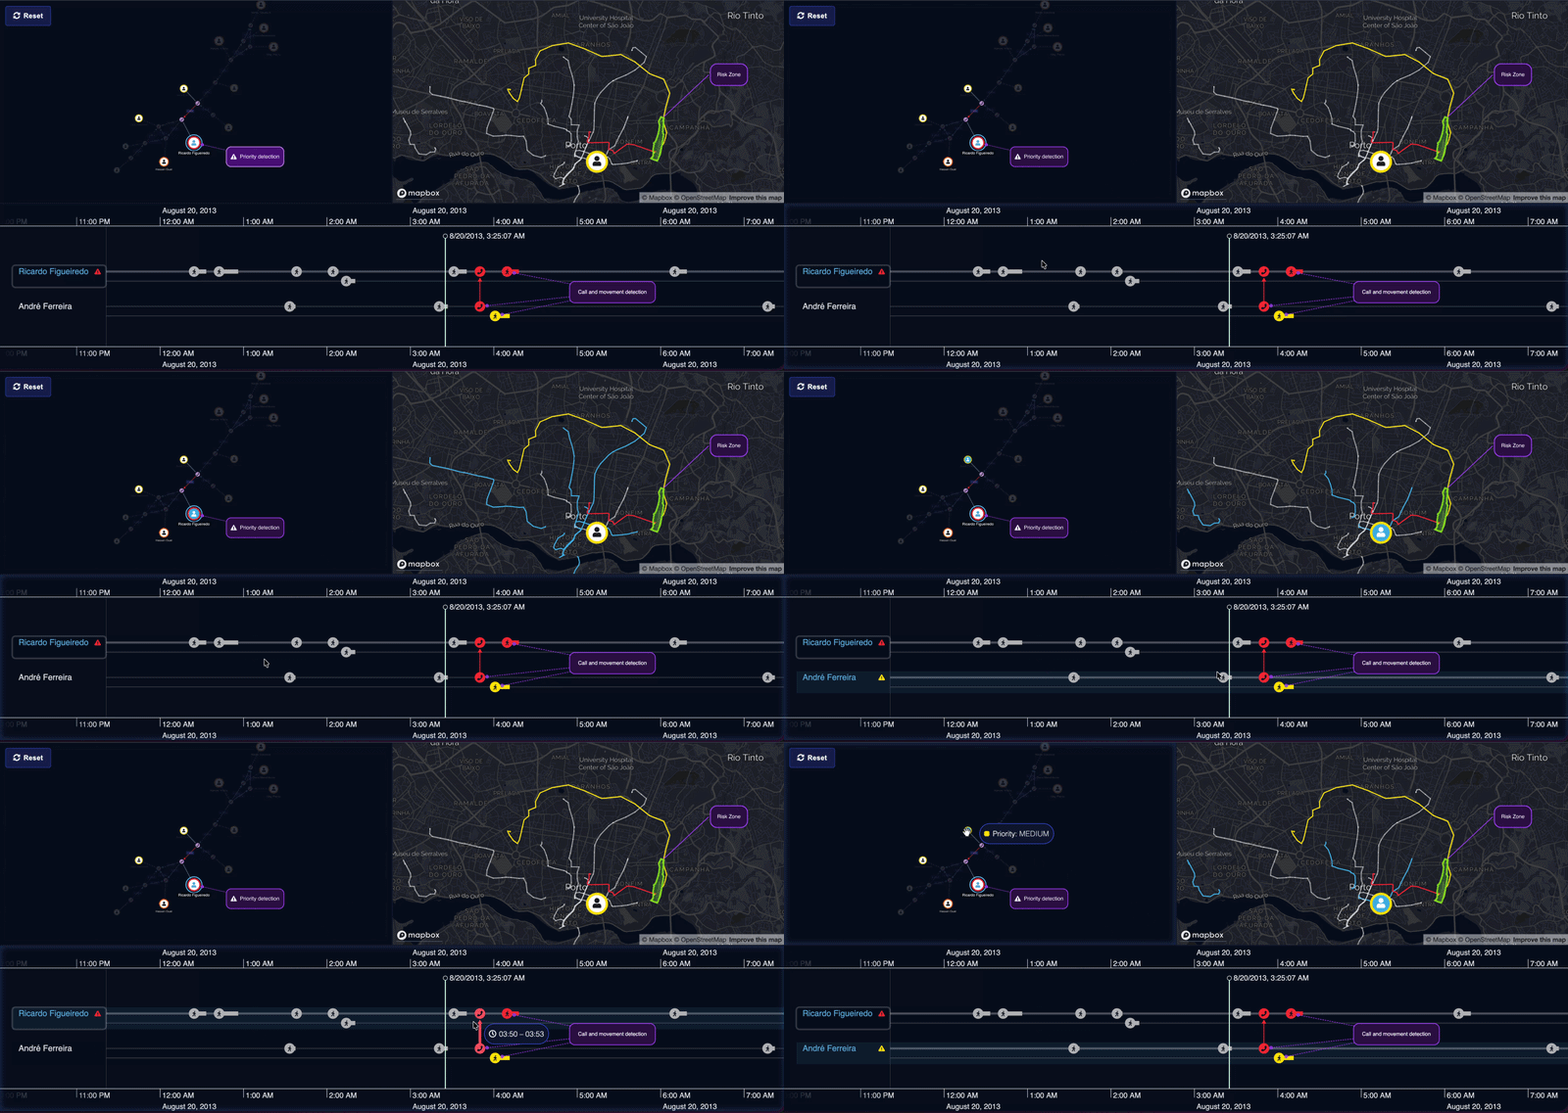
Interactivity at scale in the Data Fusion nvestigations showcase
Handling more data is only part of the story. KronoGraph 4.0 also introduces a new interactive styling approach, making it easy to update styling at runtime and build engaging user experiences without impacting performance.
The new overrideStyles API allows developers to adjust the styling of key timeline elements on the fly. For example, you can highlight a hovered event with a contrasting color, mark a clicked entity with a glyph, or add an information label when an event is double-clicked.
These styling changes remain fast and responsive even with very large datasets.
Explore dense timelines with improved event folds
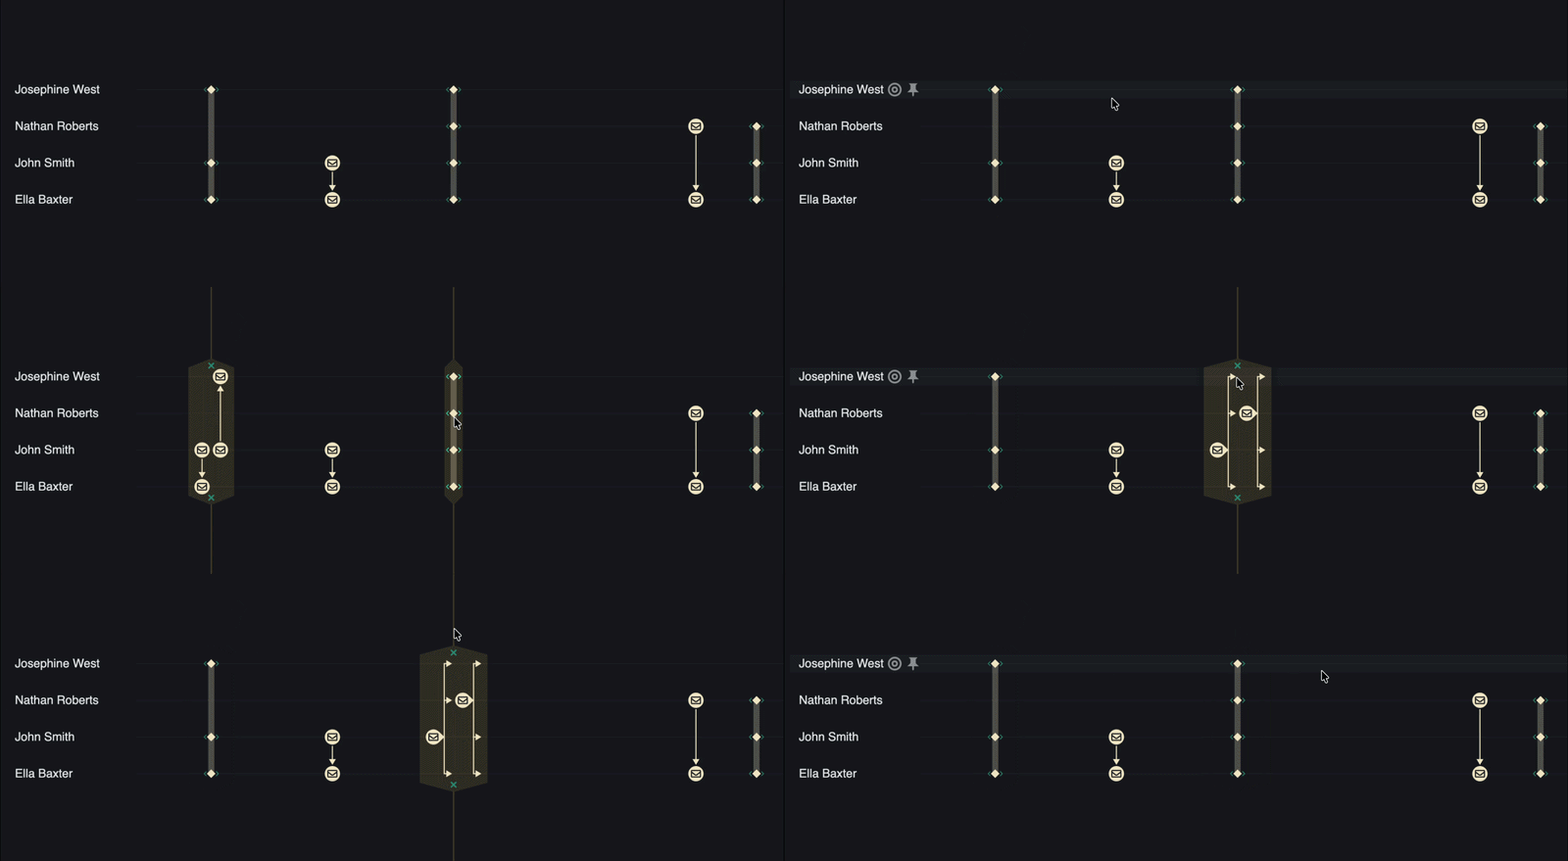
Event folds opening and closing in KronoGraph 4.0
The denser timelines become, the more important it is to give users effective ways to progressively uncover data.
One way KronoGraph supports this is through event folds. Events that happen at exactly the same time can be collapsed by default, but expanded if and when they’re needed. This helps users explore timelines efficiently while still being able to drill deeper into events happening simultaneously.
In KronoGraph 4.0, we’ve improved the visual language of event folds to show more clearly when an event fold is present and how to open or close it. We’ve also added options to adjust the colors used for event folds and their controls, helping developers keep them consistent with wider application design systems.
Bring graph, timeline and geospatial visualization together
Our Data Fusion Investigations showcase demonstrates KronoGraph’s interactive timeline visualization alongside a social network graph using KeyLines or ReGraph and geospatial visualization using MapWeave.
In this lawful intercept scenario, users can explore suspects and their mobile devices in the graph, investigate calls and movement over time in KronoGraph, and see device locations on the map. Interactions across the three views help users investigate the same connected data from different perspectives.
Explore KronoGraph 4.0
KronoGraph 4.0 let’s developers build applications that can handle hundreds of thousands of time-based events smoothly while creating richly interactive experiences for end users working with complex datasets.
Explore the latest release in more detail:
Want to try KronoGraph yourself?
Request a free trial to explore KronoGraph with your own data.
Share: