
From improved combo interactions to interactive timeline styling and routed network links, our latest SDK updates give users new ways to explore connected data across graph, timeline and geospatial visualizations.
The latest releases of our SDKs include KeyLines 8.12, ReGraph 5.12, KronoGraph 4.0, and MapWeave 1.9 and 1.10.
More responsive combo interactions

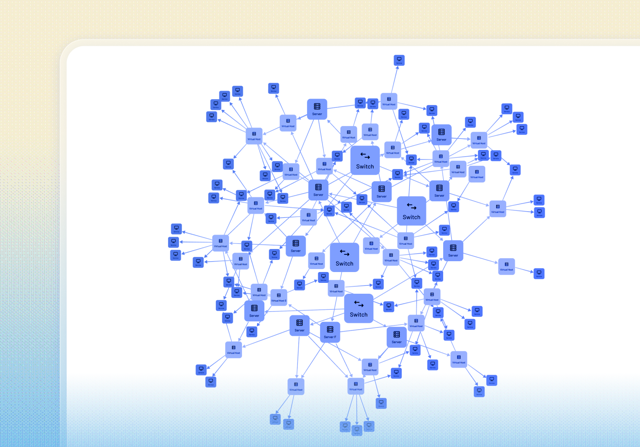
Organic layout charts with a small number of nodes are now more symmetrical.
We’ve significantly improved combo performance in KeyLines and ReGraph, particularly on very large charts. Combos now open and close up to 6x faster, while dragging and interacting with them feels smoother and more responsive.
This makes drilling down into complex, nested datasets more fluid.
We’ve also improved the Organic layout for smaller charts. Nodes are now arranged more symmetrically and balanced out of the box, making the data easier to read and interpret.
Combos on large charts now open and close up to 6x faster
Explore larger timelines with KronoGraph 4.0
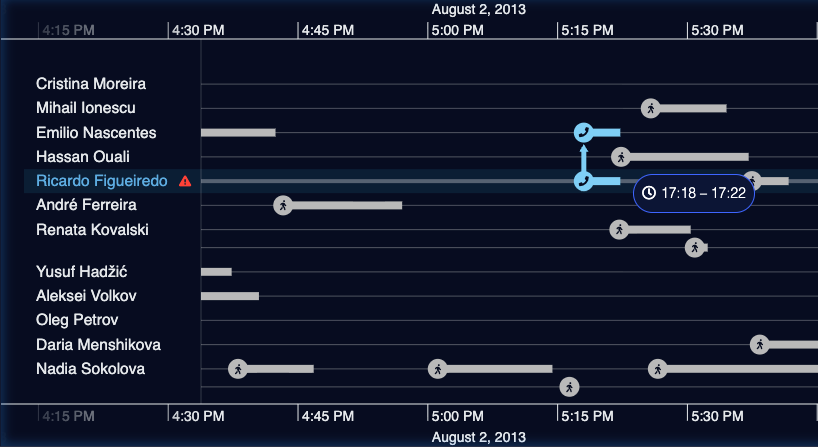
Restyle items at runtime in KronoGraph 4.0.
KronoGraph 4.0 significantly improves performance at scale. Where previous versions comfortably handled tens of thousands of time-based events, developers can now build timeline visualizations containing hundreds of thousands of events while maintaining a smooth user experience.
The release also introduces a new option to restyle timeline elements at runtime. The overrideStyles() API lets developers temporarily restyle events, entities, labels, and other elements on the fly, without reloading the whole dataset.
Styling can be applied dynamically in response to interactions such as hover or click. For example, developers can highlight a hovered event, mark a clicked entity with a glyph or add an information label to an entity. These changes remain fast and responsive even with very large datasets.
We’ve also improved the user experience around event folds, making them easier to identify and interact with, and introduced our new Data Fusion Investigations showcase. It demonstrates how graph, timeline and geospatial visualizations can work seamlessly together in a single application.
Richer geospatial network visualization with MapWeave
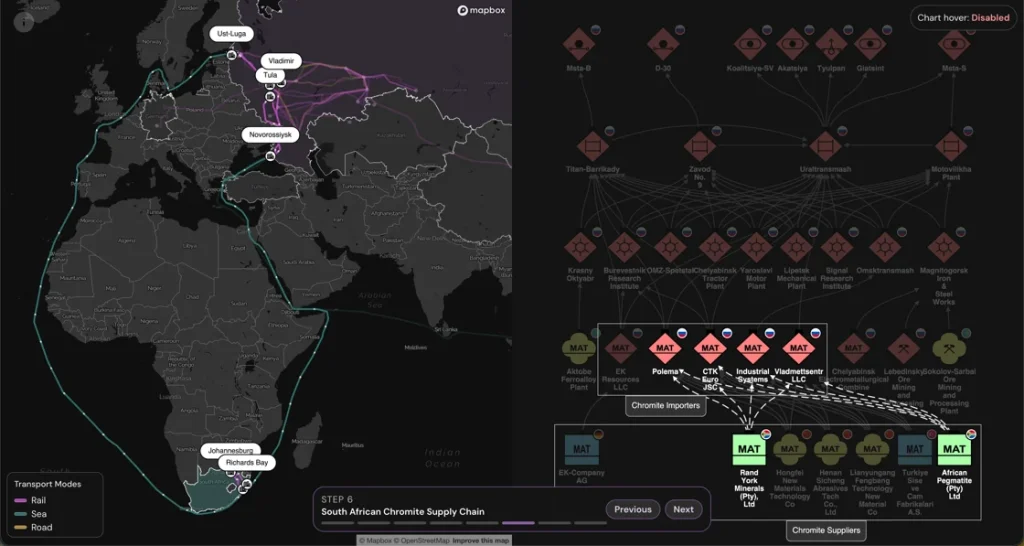
Route geometry in MapWeave 1.10 show links as they are on the ground.
Network connections on a map don’t always follow a straight line. MapWeave can now visualize links using route geometry, making it possible to show power lines, railway tracks, shipping lanes and other connections as they are on the ground.
Developers still benefit from graph visualization features such as centrality algorithms, animated flow and full user interactivity, while showing the real-world geography of the network.
Our Artillery Supply Chain showcase demonstrates the feature in action, combining graph visualization with MapWeave to analyze a global supply chain network.
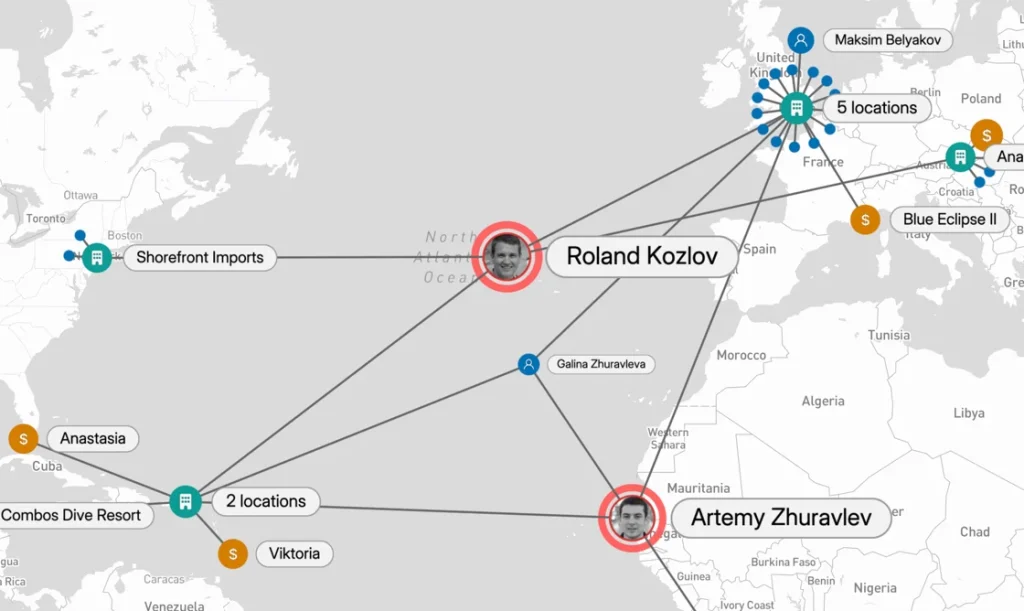
Halos add styling variety in MapWeave 1.10
MapWeave also has two new ways to draw users’ attention to important network and tracker nodes.
Animated pings can focus attention on key events, such as an alert or suspected ship-to-ship transfer, while halos can add emphasis to important nodes or represent an additional dimension of data.
Both features bring capabilities already available in our graph visualization SDKs to MapWeave, giving developers more consistent ways to style and highlight network data across graph and geospatial views.
See the changes for yourself
In complex analytical and investigative workflows, small improvements to interaction can make a meaningful difference. Users need to move through large datasets without losing context, spot important activity quickly and explore the same data from different perspectives.
These latest releases give developers more ways to create those experiences across graph, timeline and geospatial visualizations.
Explore the latest releases, developer examples and showcases on our SDK site.
Want to try the SDKs yourself?
Request a free trial to explore KeyLines, ReGraph, KronoGraph and MapWeave with your own data.
Share: