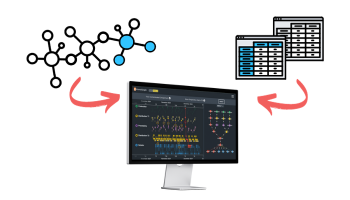
This blog post was published some time ago, and the code examples may no longer work as expected. If you have any problems following along, let us know – we’ll be happy to help.
About Google Web Tools
In this blog post we’ll show how to integrate a KeyLines network visualization application with a Java application using Google Web Tools.
But first, the basics.
Why should I (not) build my web application in Java?
Java is a programming language used for building applications. Over the years, it’s become a popular option for a whole range of reasons:
- It’s a simple language with a vast API
- It’s platform independent
- It’s established enough that most developers know how to work with it
- It’s great for large-scale, complex backend development.
For modern web application development, however, Java has fallen out of favor.
Firstly it’s a poor option of front-end / UI design, but the real killer is the Java browser plugin required to deploy into a web browser – they’re insecure and have too many notifications.
Instead, JavaScript is a better front-end scripting alternative for most applications, offering lightweight yet complex functionality and near 100% browser compatibility.
What is Google Web Tools?
Google Web Tools (GWT) is a nice option for Java developers who’ve been charged with updating their application for the web.
It allows developers to write the code for their UI in familiar old Java in the form of GWT ‘widgets’ which are then translated into JavaScript.
Integrating GWT and KeyLines
Step 1: Understanding JSNI
The keyword in this integration task is JSNI (or JavaScript Native Interface). These are a feature of GWT that allows for the integration of handwritten or 3rd party JavaScript with the GWT Java source code. They also expose some low-level browser functionality that cannot be found in the GWT class API.
Using the JSNI requires the use a strange looking syntax:
private static native KeyLines setupKeyLines()/*-{ // Javascript code here... }-*/;
And some JavaScript global objects need to be handled carefully, like Window ($wnd) and Document ($doc).
Step 2: Setup the environment
We’d recommend using the package structure shown below:
The KeyLines assets are organized in the War folder, under assets, css, font and js.
Step 3: initialize KeyLines instance
The KeyLines class will work as a wrapper, and extends the JavaScriptObject class.
As you see it’s quite simple. It initializes the KeyLines instance (if not yet defined) using the singleton pattern, and creates a chart on the DOM element with the given id String:
package com.keylines.gwt.client; import com.google.gwt.core.client.JavaScriptObject; public final class KeyLines extends JavaScriptObject { // This is a singleton representation of the KeyLines namespace private static KeyLines instance; // This has to be protected protected KeyLines(){} // This is the public API call to create a chart public static void createChart(String id){ createInstance(); createChart(instance, id); } // Ensure that KeyLines has been setup correctly private static KeyLines createInstance(){ if(instance == null){ instance = setupKeyLines(); } return instance; } // Setup KeyLines with some Javascript code private static native KeyLines setupKeyLines()/*-{ // setup KeyLines here $wnd.KeyLines.mode('auto'); $wnd.KeyLines.paths({ assets: 'assets/' }); return $wnd.KeyLines; }-*/; // This method is wrapped by the public API method above private static native void createChart(KeyLines kl, String id)/*-{ // calling a “global” Javascript function here // note the windows $wnd object kl.create(id, $wnd.onChartReady); }-*/; }
The onChartReady callback will then be defined inside a Javascript file – in the war/js folder – where you want to put some logic.
/** * This source file contains some JS functions used by KeyLines */ var chart; function onChartReady(err, loaded){ chart = loaded; chart.load(myData); }
Step 4: Transform to Java
The setupKeyLines method returns a Javascript Object that the compiler will transform into a Java Object.
The instance will be forwarded to the createChart that creates the chart.
At this point the entrypoint class is also quite simple:
package com.keylines.gwt.client;
import com.google.gwt.core.client.EntryPoint;
/**
* Entry point classes define onModuleLoad()
. */ public class GWTIntegration implements EntryPoint { /** * This is the entry point method. */ public void onModuleLoad() { KeyLines.createChart("kl"); } }
Step 5: See your network!
Starting the application in Eclipse as a (Google) Web Application, you should see a working KeyLines component with data loaded from a JavaScript file:

Note: the GWT application will startup when all the assets are loaded, so we don’t need to use the window.onload callback (or the equivalent jQuery version $(window).load ).
Step 6: Complete the event loop
AJAX communication is the next step in this case, implementing the GWT RPC (asynchronous) Interfaces to pass the data from client to server, creating an event loop for user interactions:

And that’s it! We can’t say that KeyLines / GWT integration is as straightforward as integrating it with a pure JavaScript application, but it is possible!
Try it for yourself
If you have any questions about integrating KeyLines with a Java application using Google Web tools, or if you would like to give it a go for yourself, just get in touch.
If you would like to learn more first, we have details of use cases and more getting started guides on our downloads page: