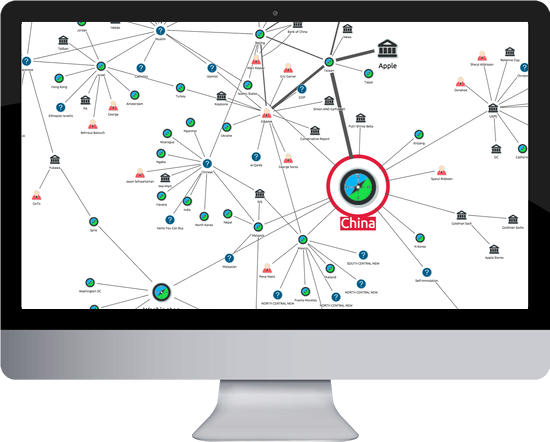
This case study explains how iMapData have used the power of the KeyLines network visualization toolkit in their threat intelligence platform.

Highlights
- iMapData use KeyLines to visualize risks in social media data.
- Visualization component was ready for customer deployment within three weeks.
- Users report saving hours, or even days, on data discovery activities.
Background
For the past 30 years, iMapData has worked with Fortune 500 companies and US government agencies, helping them to identify, understand and proactively mitigate threat.
From their McLean VA base, they manage a 24/7 data collation and cleansing operation, bringing together vast volumes of information about their customers’ critical assets. Customers then access and analyze this data using the Advanced Intelligence Management System™ (‘AIMS’) – iMapData’s SaaS platform. AIMS™ contains a suite of data exploration, analysis and visualization tools that empower organizations to identify, assess and respond to threat intelligence as it evolves.
In August 2015, iMapData released a KeyLines network visualization component in their threat intelligence platform for exploring and analyzing social media datasets.
Managing a threat intelligence platform
Three-quarters of online American adults use social media. Facebook has nearly 1.5bn active users worldwide. In this environment, organizations serious about risk and threat need to be looking at their social media footprint.
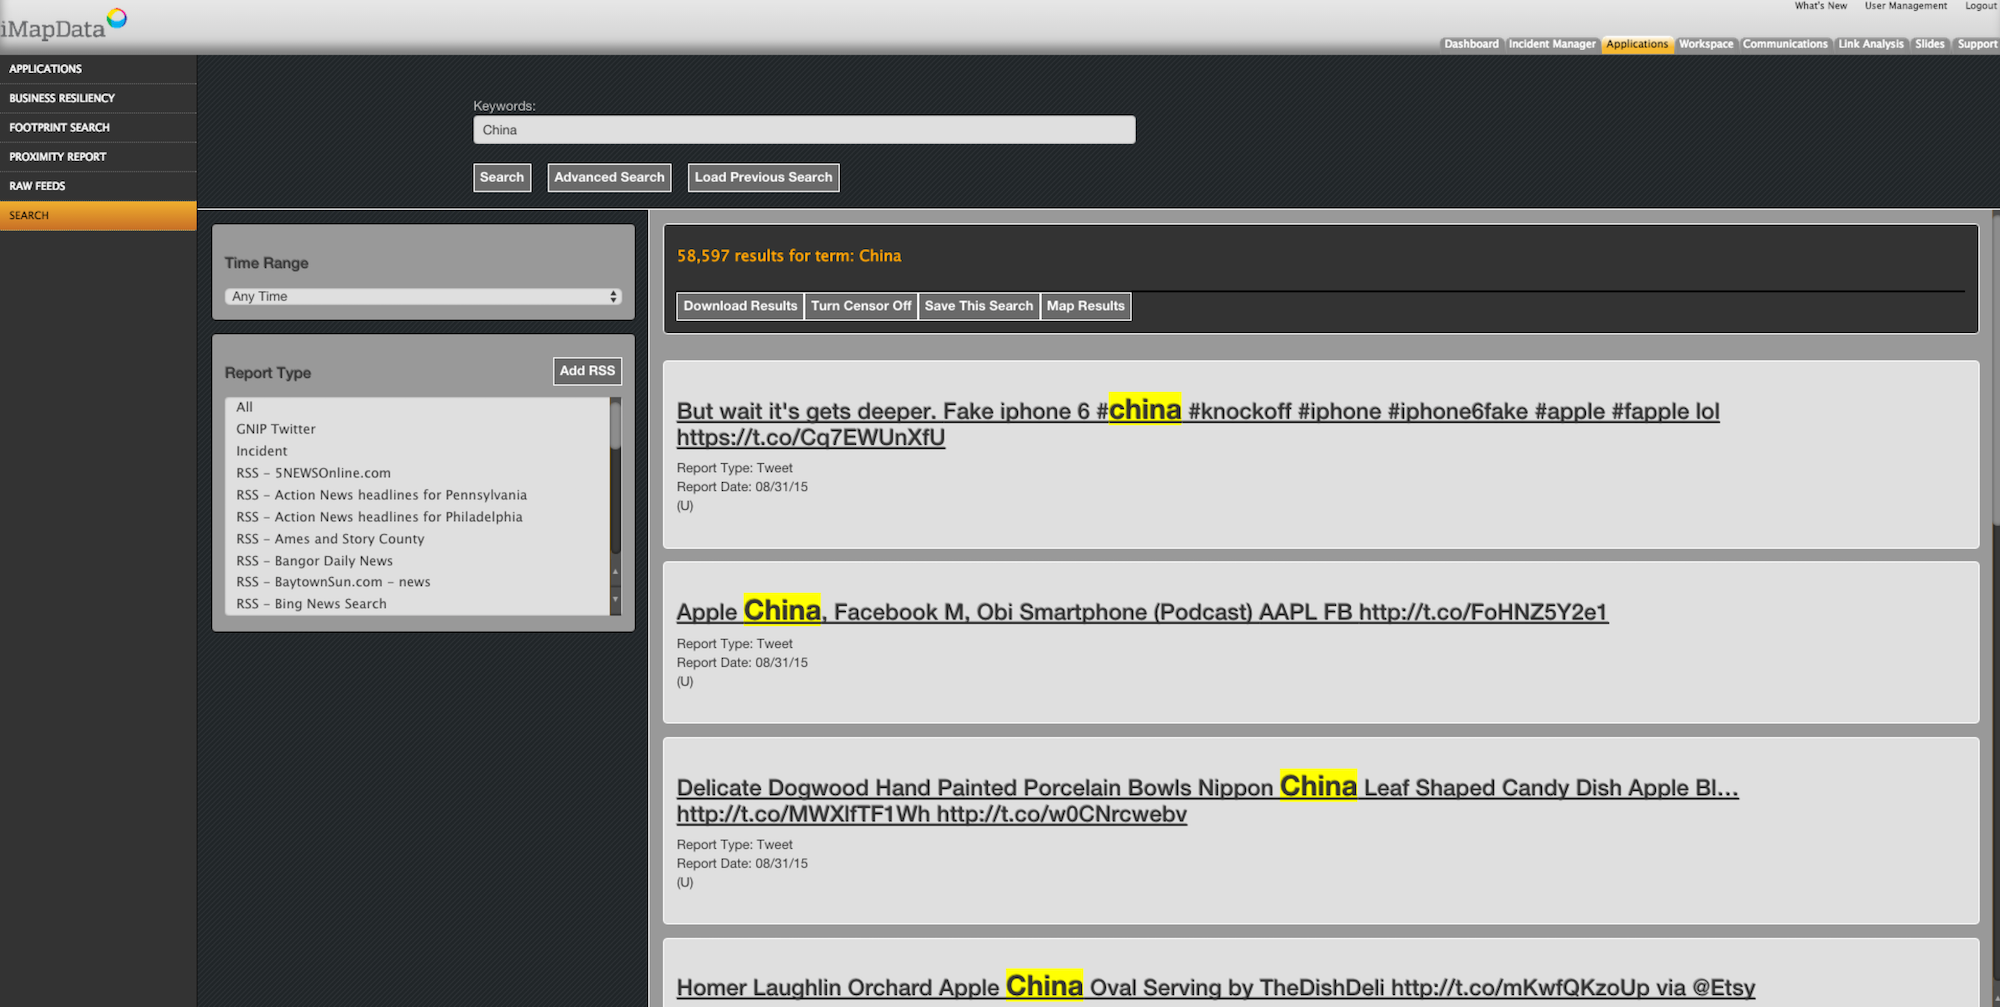
For some time, the AIMS platform has included a social media search component:

With a combination of natural language programming (NLP) algorithms and a powerful keyword search function, users of the threat intelligence platform are able to explore iMapData’s huge curated social media databases. Results are presented in list form, with hyperlinks between related documents.
A review of customer feedback led iMapData’s product team to explore network visualization as an alternative way to present this complex connected social data. As iMapData’s VP of Product Development, Neil Sobin, explains:
“Our customers’ problems change every day. There are new threats, bad actors, and vulnerabilities emerging across the globe constantly, exposing our customers to real harm. As such, it is vital for security analysts to be able to rapidly discover risk information related to their interests – whether they be people, brands, social media accounts, or other entities.
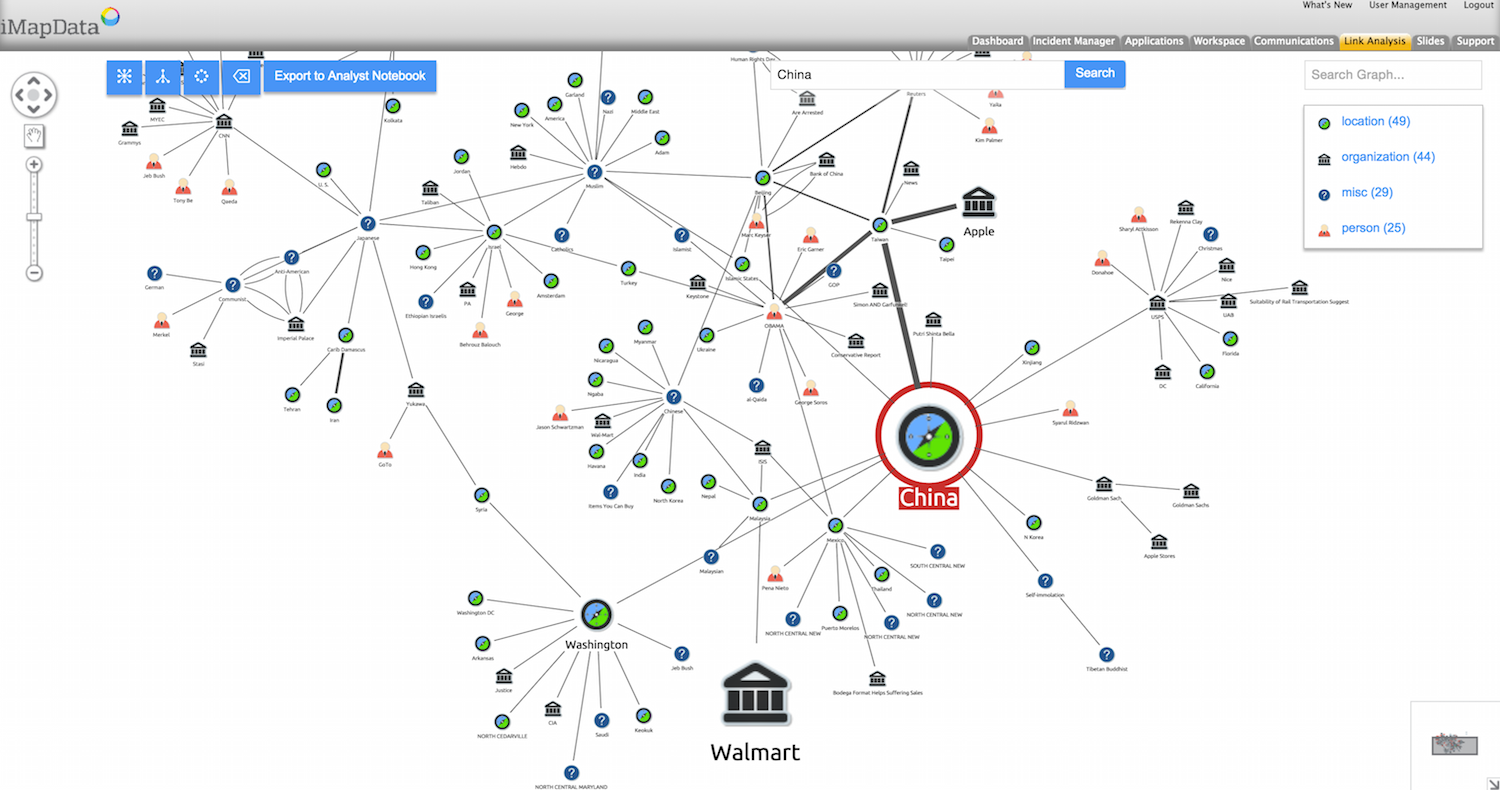
We knew that by visualizing this data as a network, we would provide faster access to that threat insight, in a format that can be communicated quickly to stakeholders.”
Building a visual threat intelligence platform
iMapData identified four critical criteria for their network visualization solution:
- Compatible – The AIMS™ threat intelligence platform is designed to bring critical intelligence data to users, anywhere in the world. Compatibility with different devices and browsers is essential.
- Extensible – AIMS™ is a growing and evolving platform. The visualization solution would need to be compatible with future growth and development.
- Feature rich – iMapData add value to their data through a year-round program of manual cleansing, but also by providing sophisticated end-user analysis tools. The network visualization solution would need a rich and evolving library of functionality that could be incorporated into their application.
- Speed of integration – iMapData look to continuously improve the value provided to their user community. Significant enhancements like visualization would need to be implemented quickly and efficiently and maintain the high standards of performance expected by their demanding users.
The Solution
The iMapData Product team reviewed a variety of options, including a commercial Java-based data visualization technology and D3.js.
Neil Sobin explains the process:
“We quickly reached the conclusion that the other commercial technology would not be suitable for us. As a Java-applet based product, it failed to meet our important compatibility criteria, and also lacked extensibility.
Then we began to explore building our own native solution using D3. We were pleased with the compatibility and extensibility the library offered, but it lacked the rich functionality we needed. It would have required a tremendous amount of development input to build even a simple network visualization component.
At this point, we looked at KeyLines, which met all of our big-four criteria. The developers experimented with the SDK and really liked it. Our business stakeholders appreciated the use cases on the website.”
In July 2015, the team set to work building a production-ready KeyLines component.
The Result
In just three weeks, a candidate was ready for deployment to government and commercial customers. Following the release, usage of the text-based legacy social media search tool plummeted as users took advantage of the more intuitive network visualization version of the threat intelligence platform.
Neil Sobin explains how the new approach has saved customer time and helped analysts to produce more accessible security briefings:
“Our customers are delighted with this new approach to data exploration. We have transformed real-time discovery on massive data sets from a laborious process of reviewing lists to accelerated graph analysis. Our customers have reported that the data discovery activity has been reduced by hours – even days in some cases.
Furthermore, the process producing real threat intelligence reports, worthy of briefing senior leadership, is now to a point where all levels of the organization can interpret the graph. The analyst no longer needs to rely on PowerPoint slides. Now they can brief colleagues with an interactive, web-based tool.”


