Interactive graph visualization: 4 easy styling options
Kevin Naughten Senior Product Manager
15th June, 2021 | 8 min read
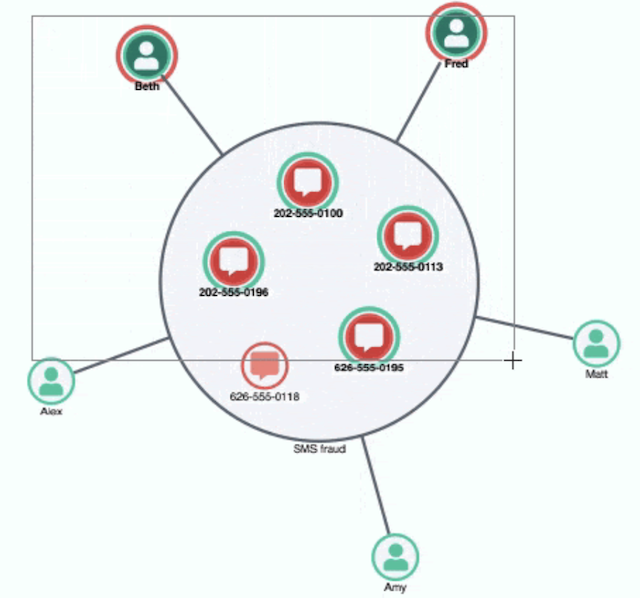
Interactive graph visualization just got easier! These 4 examples show how to customize hover and select behavior...
Kevin Naughten Senior Product Manager
15th June, 2021 | 8 min read
Interactive graph visualization just got easier! These 4 examples show how to customize hover and select behavior...
Catherine Kearns Content Strategist & Team Lead
16th March, 2021 | 3 min read
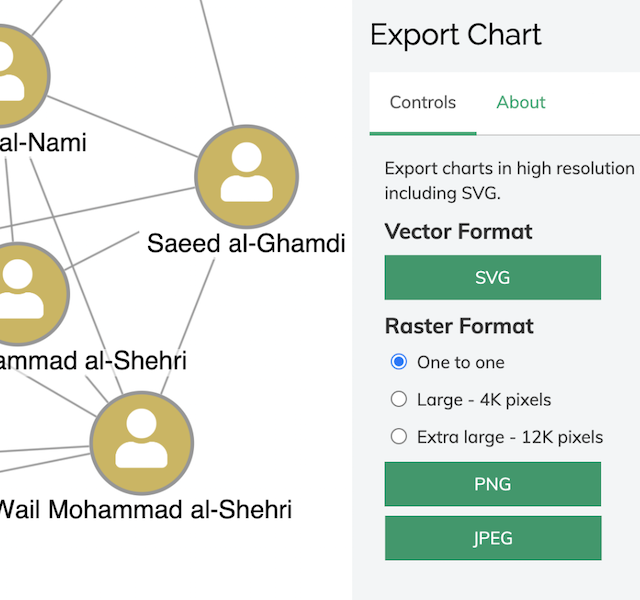
Learn how KeyLines delivers ultra high-resolution chart export (16K) to PNG & JPEG – plus support for...
Dan Williams Chief Product Officer
8th December, 2020 | 4 min read
Our latest toolkit updates include rectangular combos, a revised KeyLines Neo4j tutorial, and ReGraph support for...
Dan Williams Chief Product Officer
22nd July, 2020 | 3 min read
We’re excited to release KeyLines 6.0 – the latest major version of our graph visualization toolkit for...
Dan Williams Chief Product Officer
20th November, 2018 | 2 min read
We’re excited to announce the release of KeyLines 5.0: the next generation in visualizing connections in...
Registered in England and Wales with Company Number 07625370 | VAT Number 113 1740 61
6-8 Hills Road, Cambridge, CB2 1JP. All material © Cambridge Intelligence .
Privacy Policy | Security Framework
