Product update: 3 ways to style & declutter graph visualizations
Kevin Naughten Senior Product Manager
12th December, 2023 | 3 min read
With every version of our KeyLines and ReGraph graph visualization toolkits, we aim to share new features that...
Kevin Naughten Senior Product Manager
12th December, 2023 | 3 min read
With every version of our KeyLines and ReGraph graph visualization toolkits, we aim to share new features that...
Kevin Naughten Senior Product Manager
18th July, 2023 | 2 min read
KeyLines 7.2 and ReGraph 4.2, the latest versions of our graph visualization toolkits, are available now. The big...
Kevin Naughten Senior Product Manager
30th May, 2023 | 3 min read
KeyLines 7.1 & ReGraph 4.1 feature big performance gains and greater flexibility for our popular sequential...
Dan Williams Chief Product Officer
7th March, 2023 | 3 min read
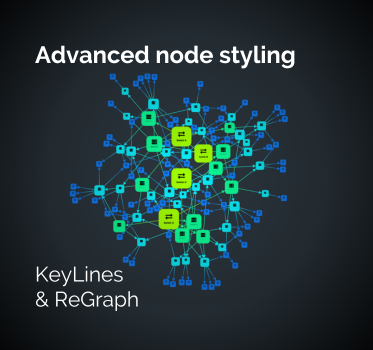
KeyLines and ReGraph deliver an advanced level of node styling capability and almost limitless customization...
Kevin Naughten Senior Product Manager
27th September, 2022 | 2 min read
The latest releases of our graph visualization SDKs bring more control over combos, and a live coding environment...

Dan Williams Chief Product Officer
31st May, 2022 | 2 min read
The latest updates to our graph visualization toolkits include new testing APIs and a live-coding...
Dan Williams Chief Product Officer
15th March, 2022 | 2 min read
By popular demand, KeyLines 6.9 and ReGraph 3.6, our graph visualization toolkits, give you even more control over...
Dan Williams Chief Product Officer
7th December, 2021 | 2 min read
Serious improvements to KeyLines & ReGraph layout performance, plus a playground & localization support...
Dan Williams Chief Product Officer
31st August, 2021 | 3 min read
Find out what’s new in our latest KeyLines & ReGraph releases. Highlights include improved rectangular...
Registered in England and Wales with Company Number 07625370 | VAT Number 113 1740 61
6-8 Hills Road, Cambridge, CB2 1JP. All material © Cambridge Intelligence .
Privacy Policy | Security Framework
