FREE: Managing fraud with visual link analysis
The ultimate guide to the role of link analysis and timeline visualization in fraud detection, investigation and prevention.
In this blog post, I’ll use powerful graph and timeline data visualization to spot Amazon review fraud. We’ll use data visualization toolkits KeyLines and KronoGraph to build a hybrid fraud visualization app that’s up to the challenge.
Over 75% of people shop online at least once a month, so chances are you’re one of them. And given their position as a global eCommerce superpower, you may well have bought from Amazon.
By the end of 2021, estimates predict that Amazon will have an incredible 50% share of the US eCommerce market (Statista, 2021). Key to this success are significant changes to consumer behaviors and expectations over the last 30 years, coupled with the development of new technologies.
Everybody knows that shopping online is quicker and more convenient than visiting a store. You can access in-depth product information, photos or videos before making a choice, using whatever device you have to hand at a time that suits you.

The one thing Amazon can’t replicate is the ability to check out the product before you buy it. The next best thing is to hear from people who’ve bought it already.
What may surprise you is how much trust people have in product recommendations from complete strangers who may not always be acting in good faith.
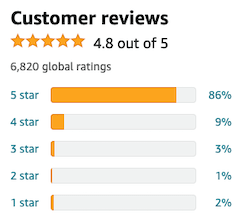
According to BigCommerce.com, research shows that 84% trust online reviews as much as a personal recommendation. And most people don’t base their buying decisions on a huge sample – 68% form an opinion after reading between one and six online reviews.
Where there’s trust, there’s also an opportunity for criminals to commit fraud.
Posting false recommendations for products in an attempt to boost sales is known as review fraud. It’s a massive problem for Amazon and other online retailers: if people lose trust in their business, they’ll shop elsewhere.
Professional fraudsters continue to exploit the product rate and review model at scale. An investigation by the SafetyDetectives cybersecurity team in 2021 discovered an organized review fraud scam implicating over 200,000 people. They found 13 million database records containing messages between Amazon vendors and customers willing to leave fake reviews in exchange for free products.
It’s not just loss of sales and reputational damage that Amazon has to worry about. The UK government recently started investigating them for possible failures to protect users from fake reviews. Not doing enough to combat review fraud is potentially breaking the law.
I wanted to understand more about the challenge facing Amazon in clamping down on this, so I chose a review fraud investigation as my first data visualization project.
The ultimate guide to the role of link analysis and timeline visualization in fraud detection, investigation and prevention.
I selected one of the many Amazon online shopping datasets available online. This one features reviews left by 199 customers for 37 Amazon products. There’s no suggestion that this dataset contains known fakes, so I’ve added fictitious details* to give us something more to dig into. It contains:
I followed the instructions in the Integrating a KronoGraph event timeline visualization with KeyLines tutorial to build a hybrid graph and timeline visualization app. This gives me two powerful ways to look at the same Amazon data, using network analysis to understand connections and timeline analysis to see how events unfold.
The data model is slightly different to meet the needs of KeyLines and KronoGraph, but the app displays:
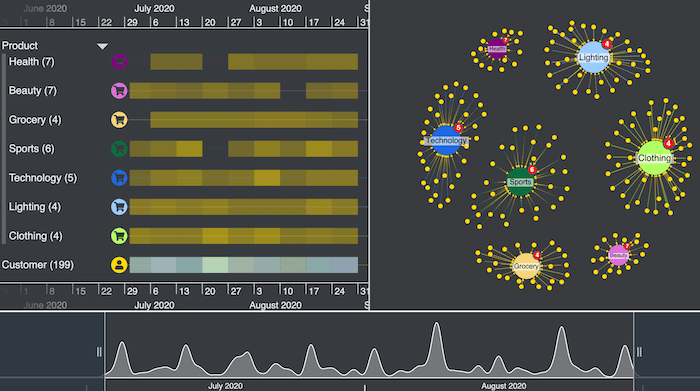
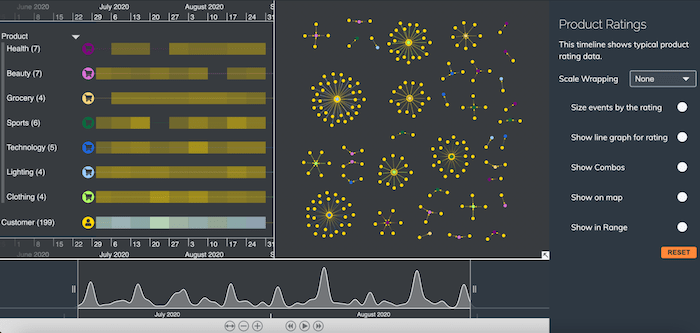
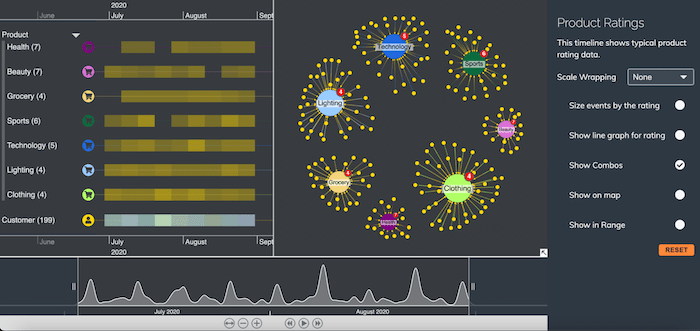
I also added a control bar on the right full of useful customized options to help me analyze the data. Here’s what I see when I load the data for the first time:
This chart view makes it easy to spot which individual Amazon products got the most reviews – each component has a product ID node in the center with links to reviewers.
If I was a review fraud analyst, I might start looking at the largest component first to see if there’s anything unusual. But instead, let’s create a simpler view and look at the data in a different way.
I can organize the chart better by grouping similar items using combos. Let’s group nodes by product category and make the chart more manageable. I’ll also apply a lens graph layout for a clearer view of the components:
The KronoGraph timeline automatically groups multiple entities by type, so we can see the entire dataset at once without getting overwhelmed. As we zoom in and out, at every point KronoGraph delivers the best possible view of the data.
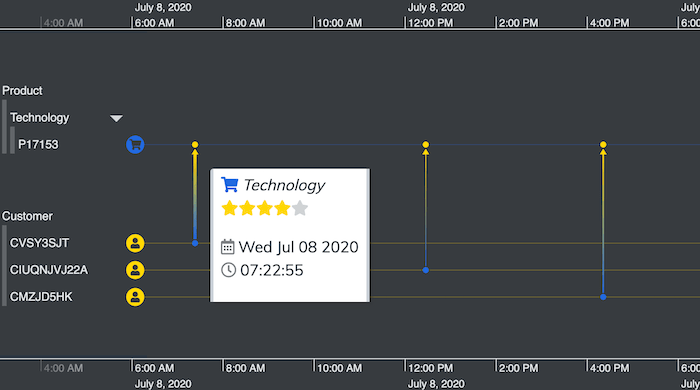
I zoom into the timeline to learn more about reviews for a particular technology product. I’ve set the connection widths to reflect the number of stars awarded by each customer – the wider the connection, the higher the rating.
Notice how these three connection widths differ slightly. At a glance I can tell which one gets the highest rating. Then I can reveal a tooltip to discover useful background information. [For details of the JavaScript you’ll need to add tooltips, see Get started with KronoGraph for JavaScript]
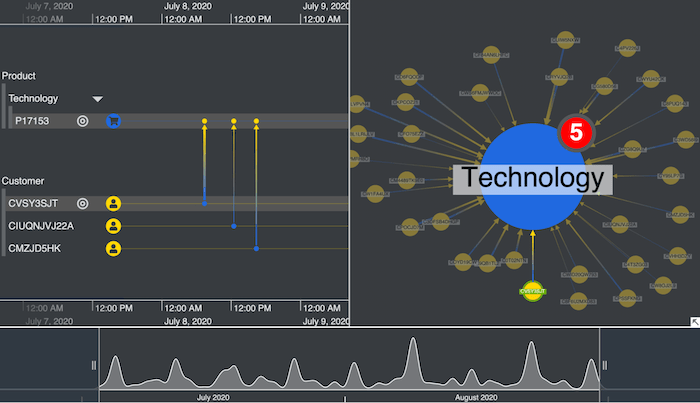
With my focus on this particular customer, I can also zoom in and see where they exist in the network chart.
Switching between timeline and network views like this is a useful way to understand the detail in your data. It can reveal suspicious customer behaviors, such as whether they only ever leave 5-star reviews for certain product types, or whether their buying habits appear unusually random.
I also added a KeyLines time bar element to my app. While KronoGraph’s timelines give the fine detail of every time-based event, the time bar is an effective way to present the entire dataset without taking up much screen space.
Using the time bar sliders, I can navigate to the peaks when a relatively high number of Amazon reviews were posted within a short period. The timelines and network chart update dynamically to reflect what’s in focus. This kind of activity may rouse suspicions – is a bot responsible? Do they relate to the same product? Did the ratings appear within minutes of the product being listed?
With several clear peaks in the number of reviews posted, let’s try and identify whether there’s an underlying pattern.
KronoGraph has a powerful scale wrapping option for revealing hidden patterns in data. It enables pattern of life analysis by wrapping data to a time period, such as hours of a day, days of a week, etc. Could this tell us anything new about our Amazon data?
I start by wrapping the data by days of the week to find out when the highest number of reviews were posted.
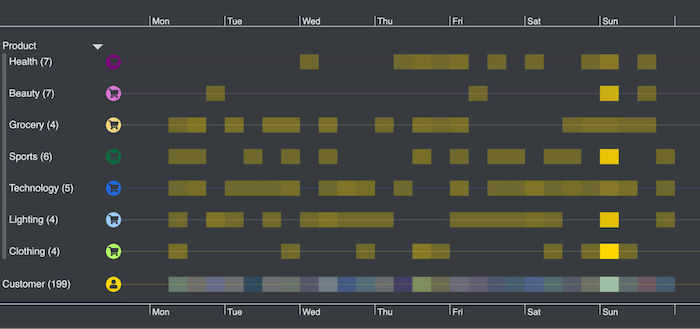
The heatmap view immediately reveals that reviewers were busiest on Sundays. There may be nothing unusual about this – do customers try out their new products over the weekend and then find time to leave a review?
I’ll try scale wrapping again, but this time focusing on the hours during Sundays.
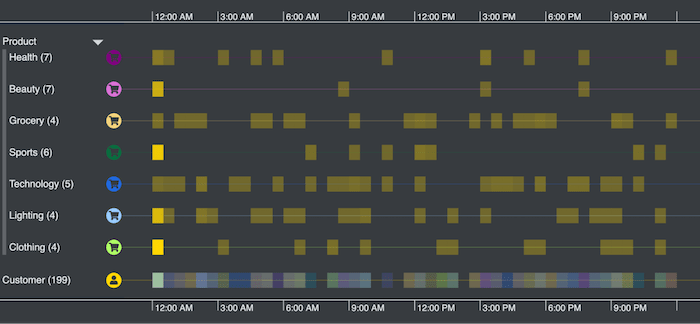
Interestingly, the highest concentration of reviews happen just after 12:00 AM. That does seem a little unusual – why are customers rating items in the middle of the night?
The products reviewed range from beauty and sports to lighting and clothing, so there’s no obvious correlation there. Random product reviews by the same reviewer is another red flag for review fraud analysts.
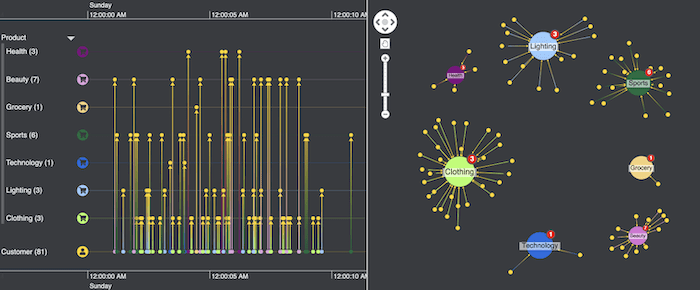
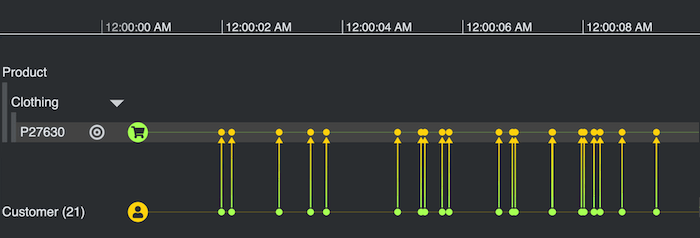
We zoom into 12:00 AM to see what’s happening in more detail. There’s a high concentration of reviews in the first few seconds of the hour, with 26 separate reviews left for just 3 items of clothing. Does this suggest there are fake review bots activated around this time?
Digging deeper reveals that most of those reviews were left by 21 different customers for the same item of clothing (product ID P27630). Coincidence?
To look more closely at our unusually ‘popular’ clothing product, let’s expand the combo in the network chart. Everything else is sent to the background to help us focus on what’s important.
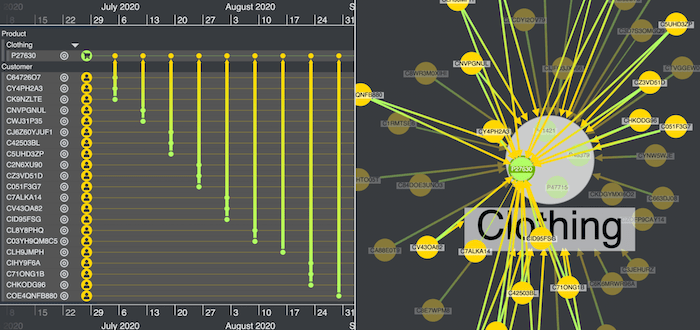
In the KronoGraph timeline we see which customers left reviews. Almost all of them are 5 star ratings. Is it really that good, or is the vendor acquiring fake reviews?
Using my custom-built KronoGraph and KeyLines app, we managed to gain a deeper understanding of our Amazon review dataset. We relied on fictitious elements in the data to mimic how fraudsters operate and tell the story of how a fraud analyst might approach an investigation into fake reviews.
Did we cover the fraud visualization techniques your users need? If so, give our technology a try.

Visualize your data! Request full access to our SDKs, demos and live-coding playgrounds.


