Network management
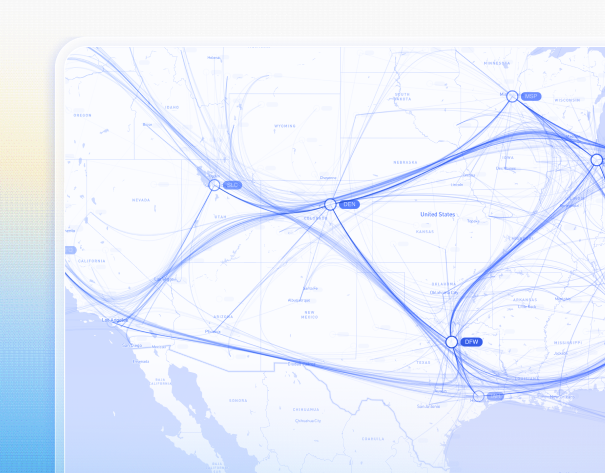
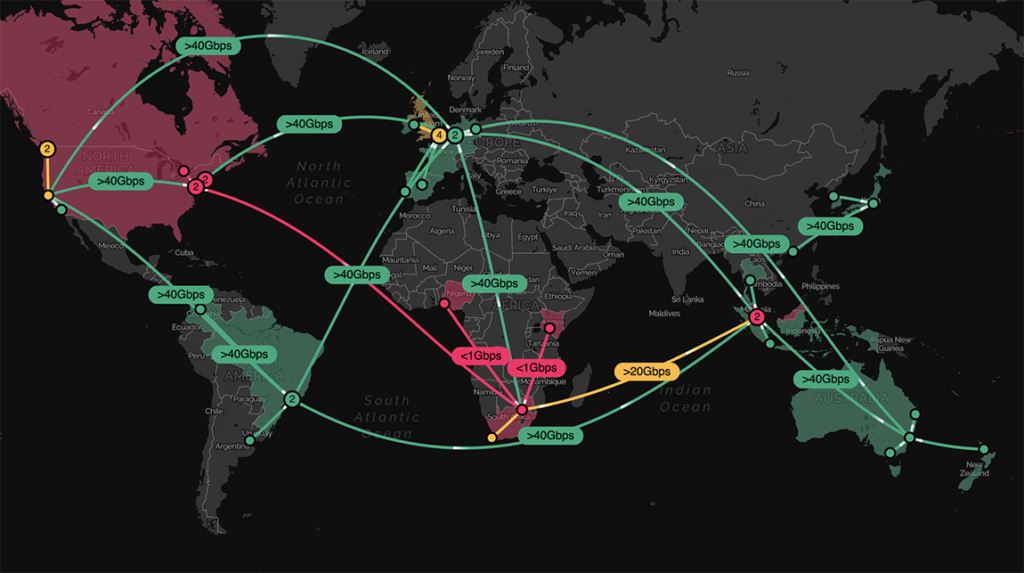
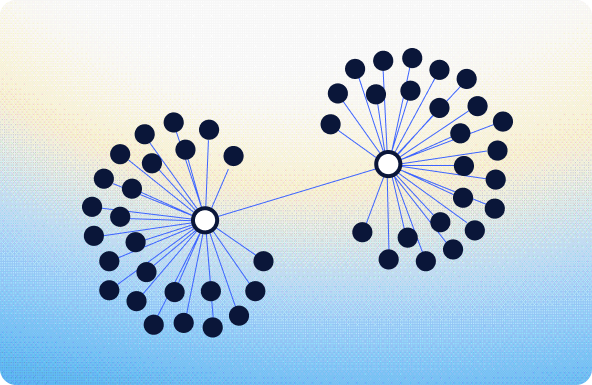
Dive into a geospatial overview of the health of a highly distributed IT or telecoms network.
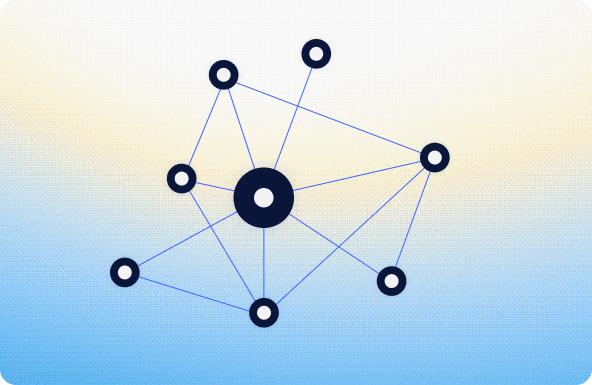
Enable teams to understand complex IT systems, so they can monitor network health, prevent outages and achieve performance and cost optimizations with interactive graph, timeline and geospatial visualization.
Trusted by 250+ organizations worldwide
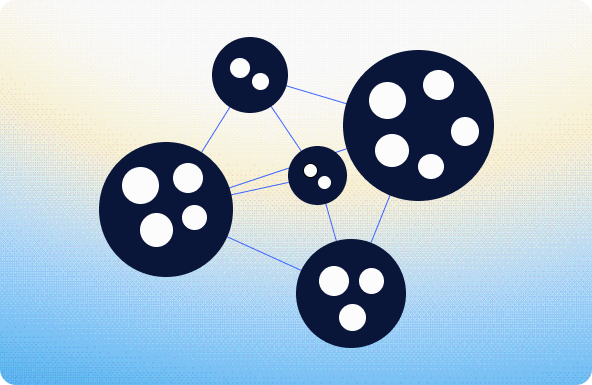
IT environments generate huge volumes of operational data across services, applications and infrastructure systems that are interconnected across cloud and on-prem environments.
The challenge is understanding how these components connect and how events propagate through the system.
Operations teams must be able to:
Interactive visualization helps engineers manage resources so they can keep critical systems running smoothly.
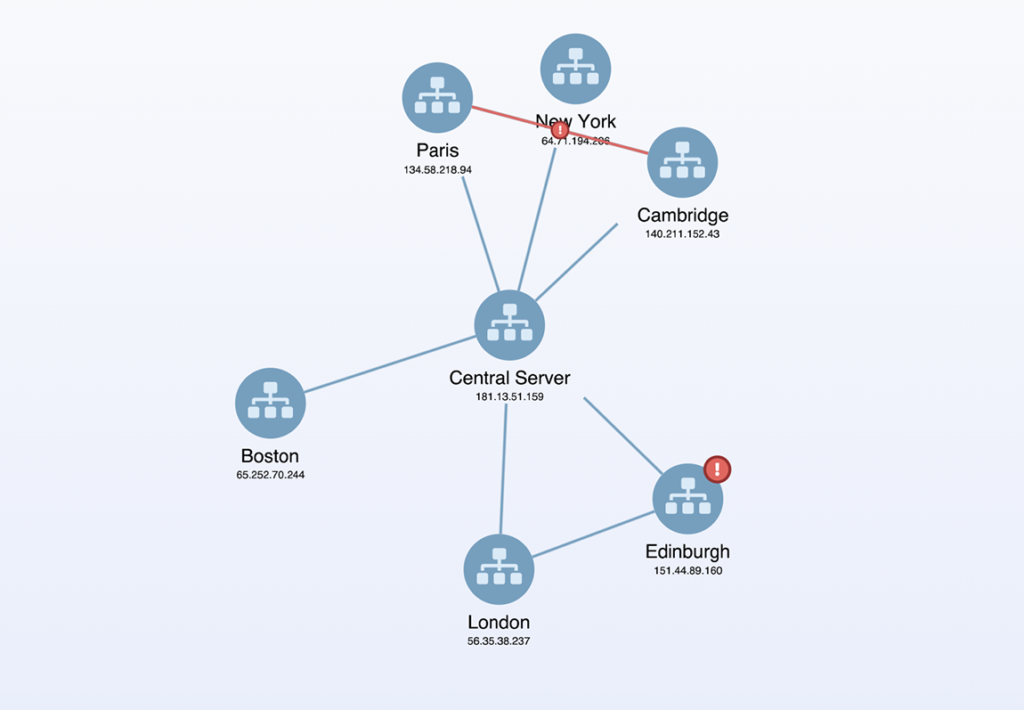
Understand how infrastructure, services and applications are connected across your environment.
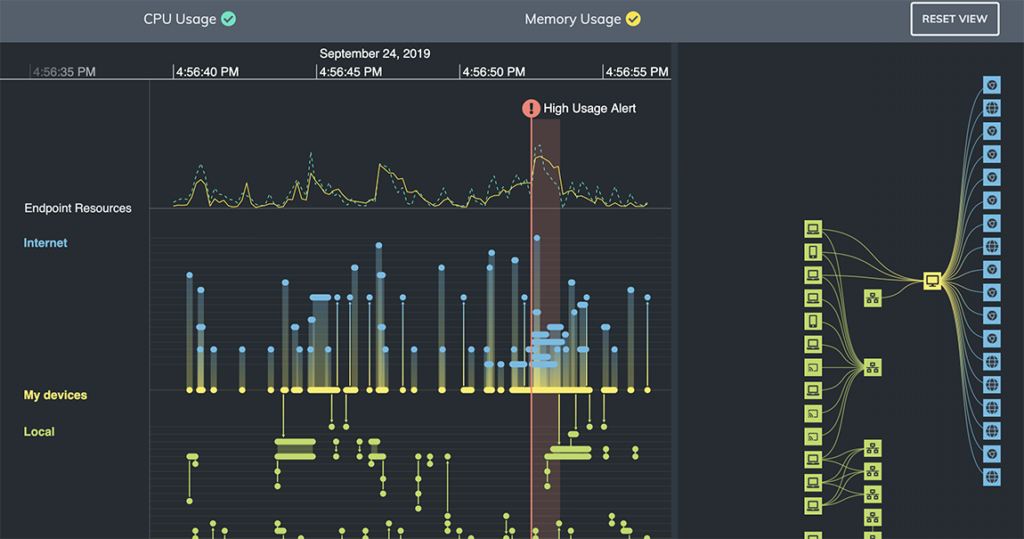
Monitor system health and performance in real time across networks, services and infrastructure to improve performance and gain efficiencies.
Identify the underlying cause of issues by tracing relationships across interconnected systems.
Investigate incidents with full context to understand impact and respond faster.
Give users the context they need to understand system behavior, resolve issues faster and keep services running reliably.

Complement dashboards with interactive visualizations that help users quickly understand how systems are structured and how they behave.
Enable users to move beyond isolated alerts and metrics to see how events unfold over time and how changes impact interconnected systems.
Present infrastructure data in a way that highlights patterns, anomalies and impact so teams can prioritize actions.
Fully customize your visualizations to match your platform and users’ needs.
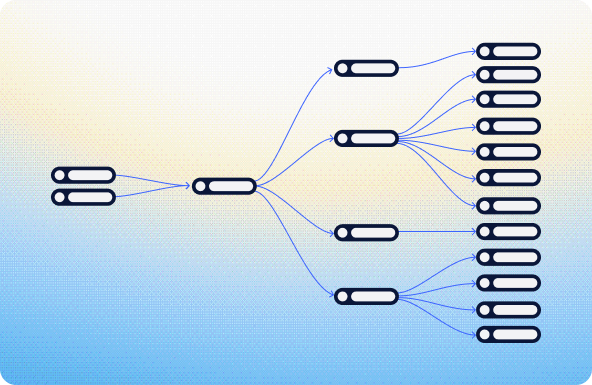
Visualize large, dynamic environments that support real-time interaction without performance compromises.
Try these interactive demos in your browser.
Dive into a geospatial overview of the health of a highly distributed IT or telecoms network.
It helps teams understand how services, applications and infrastructure are connected across complex environments.
By visualizing relationships and events, teams can trace impact, identify root causes and resolve issues faster.
Yes, our SDKs integrate with existing tools to provide deeper insight into system performance and behavior.
Yes, our technology supports real-time interaction with large, complex and distributed systems.
Bring clarity, confidence and interactive intelligence to your product – with visualizations that transform how users understand and explore complex data.