FREE: Start your trial today
Visualize your data! Request full access to our SDKs, demos and live-coding playgrounds.
EclecticIQ’s mission is to ‘restore the balance in the fight against cyber adversaries’. Their platform empowers cyber analysts to collate and analyze cyber threat intelligence as a graph, helping them to understand risks and respond accordingly.
In 2015, EclecticIQ used the KeyLines network visualization toolkit to build an interactive graph visualization that sits at the heart of their platform.
Governments and large enterprises face the increasingly complex task of keeping critical infrastructure secure. To manage this, large teams of cyber analysts are employed to continuously survey the threat landscape and proactively adjust their cyber defenses accordingly.
Internal data is combined with shared cyber threat intelligence, providing analysts with a huge potential source of insight. The scale and complexity of this information, however, is daunting.
Analysts are required to search for unknown threats in data from many different sources in multiple different formats. Unraveling and prioritizing threats in this scenario is time-consuming and labor intensive.
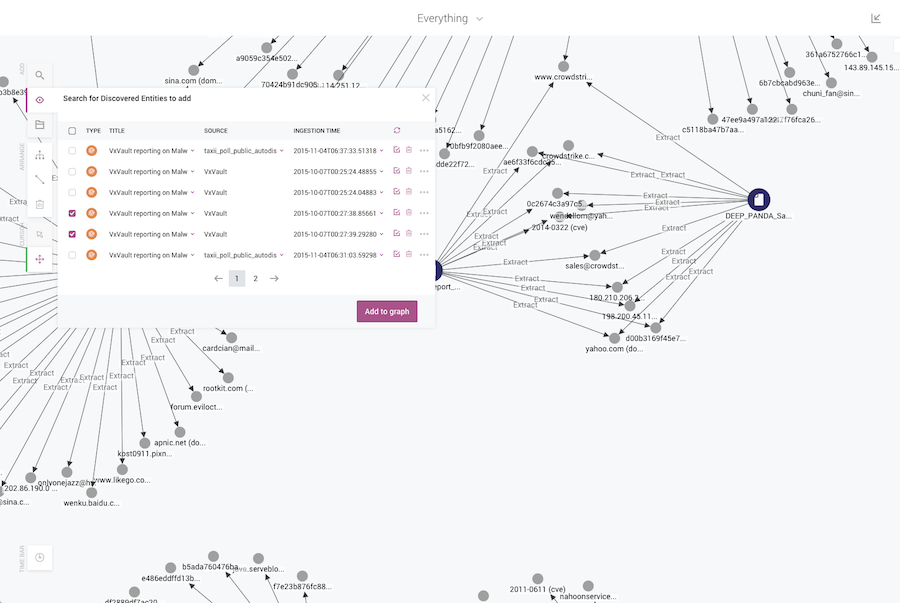
EclecticIQ identified graph visualization as a method to help cyber analysts overcome the scale and complexity challenges of threat intelligence.
As Raymon van der Velde, Co-Founder & VP Product at EclecticIQ, explains:
“Cyber threat intelligence can be anything from a list of IP addresses in an Excel file to a PDF to file hashes, and anything in between. What ties it all together is that this data is big, complex and varied. […] A KeyLines graph visualization is the ideal way to present information of this scale, complexity and variety in a way that’s easy for a user to manage.”
Watch our webinar, co-presented with the EclecticIQ team.
EclecticIQ first approached Cambridge Intelligence in May 2015, quickly starting an evaluation of the KeyLines toolkit.
They had several specific requirements:
As a start-up, EclecticIQ was keen to maximize their development resources and release the highest quality product to the market as early as possible. KeyLines, as a software development kit (SDK) enabled them to rapidly build a custom solution without diverting all resources away from other aspects of the application.
By October 2015, the application was ready to be deployed to beta customers, with excellent feedback.
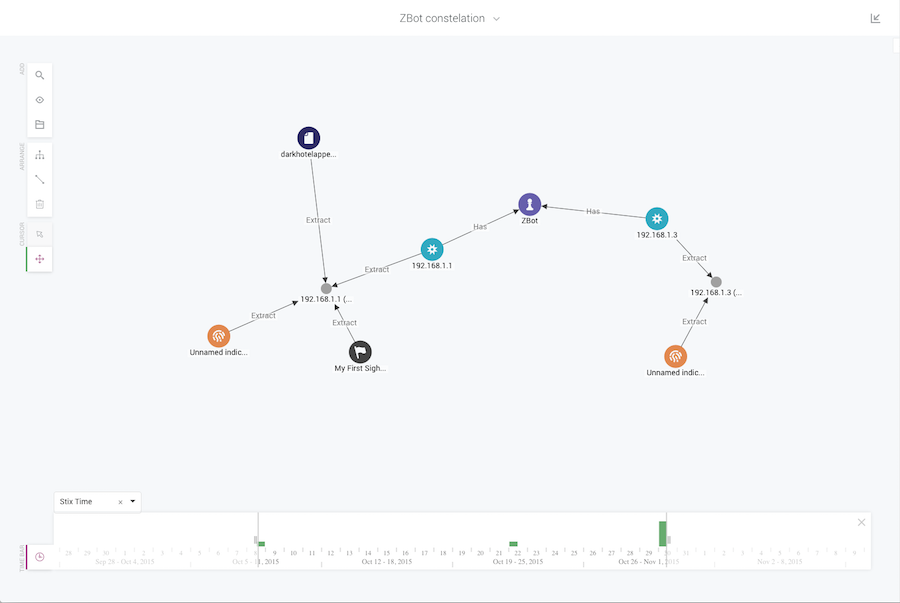
KeyLines has been used to provide interactive means of connecting and exploring very complex data. Functionality has been carefully selected to enhance the analysts’ own capabilities and guide them towards an action. Raymon van der Velde explains the importance of getting this right:
“These cyber analysts are working with the unknowns, and the unknown unknowns.
Only humans are equipped with the analytical and creative skills required to make sense of this information. We can harness the human brain’s pattern recognition capability, but we need to first find a way of interacting with the data.
KeyLines offers that: it gives analysts a way to ‘walk’ the graph. It empowers them to make sense of the data, and it does it in a very efficient way.”
“Whenever you work with a technology, there are two very important aspects: first is the quality of the product, second is the support. With KeyLines, both of those have been excellent.
The product is superb and our engineers have found the support to be very flexible and responsive. The experience has been top notch.”
Discover the power of graph visualization solutions for your enterprise platforms and unlock the potential of your data, just like EclecticIQ and others have already. Our software development toolkits provide interactive visual representations of complex relationships, so your team can easily analyze patterns and derive insights that drive strategic decisions.
If you need data visualization solution for your product, now’s a great time to start the conversation. Request a free trial today.

Visualize your data! Request full access to our SDKs, demos and live-coding playgrounds.
Registered in England and Wales with Company Number 07625370 | VAT Number 113 1740 61
6-8 Hills Road, Cambridge, CB2 1JP. All material © Cambridge Intelligence .
Privacy Policy | Security Framework


