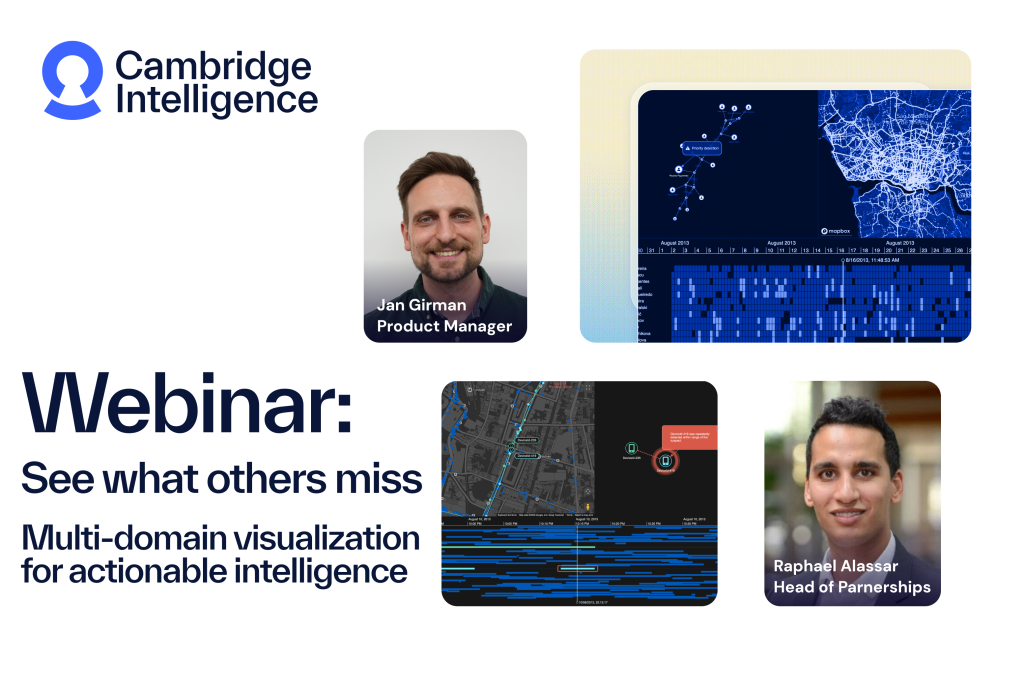
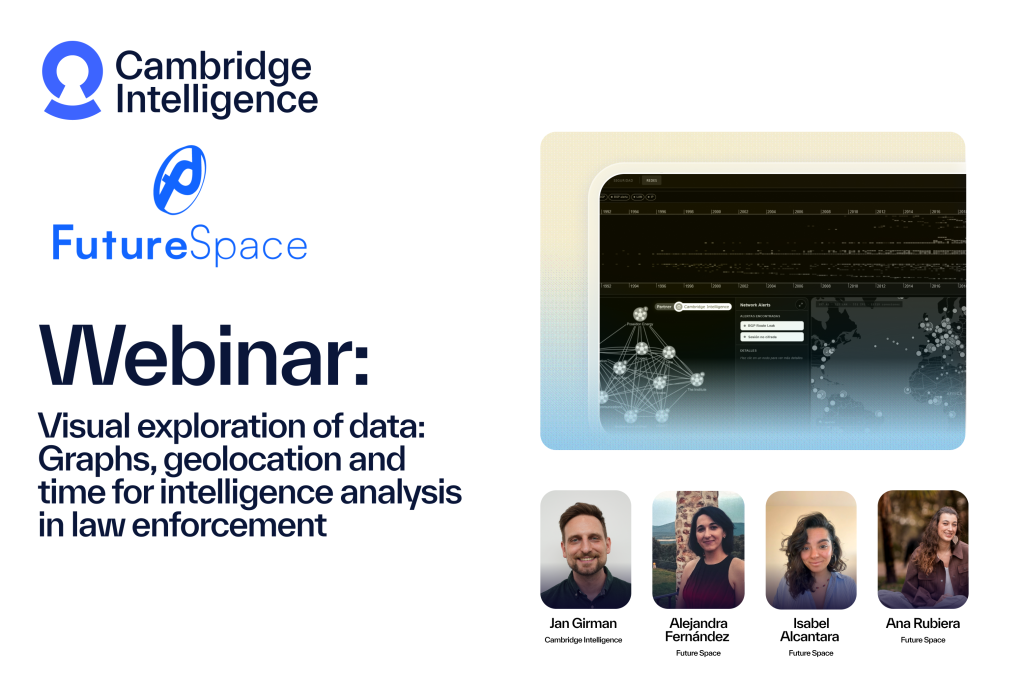
In this webinar, data visualization experts Dan Williams and Bonney O’Hanlon demo MapWeave, the latest addition to our family of data visualization SDKs.
MapWeave is a geospatial visualization SDK that uncovers every connection. You can use it to:
- Build groundbreaking apps that make geospatial connections clear, without the clutter
- Unite your map, network, and timeline insights in a single view for the first time
Explore our graph, timeline, geospatial visualization resources
Share: