Open-source intelligence – or OSINT – is the cornerstone of modern economic crime investigations.
Teams rely on data from the dark web, social media, company registers and countless other sources to fuel investigations into money laundering, sanctions violations and terror financing. But they’re hindered by one overwhelming data challenge: complexity.
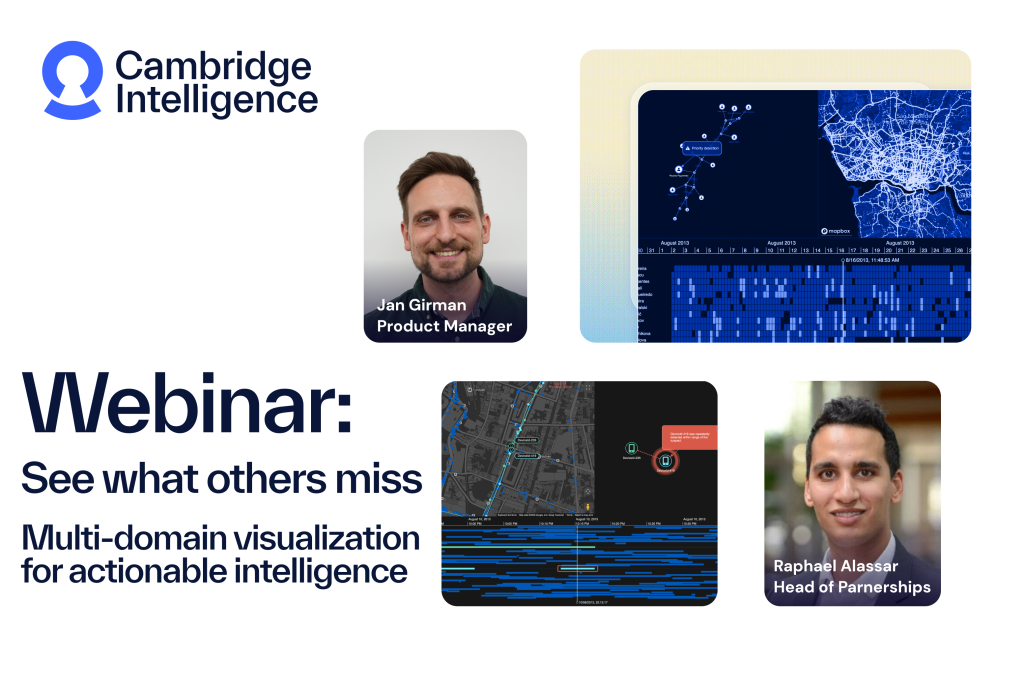
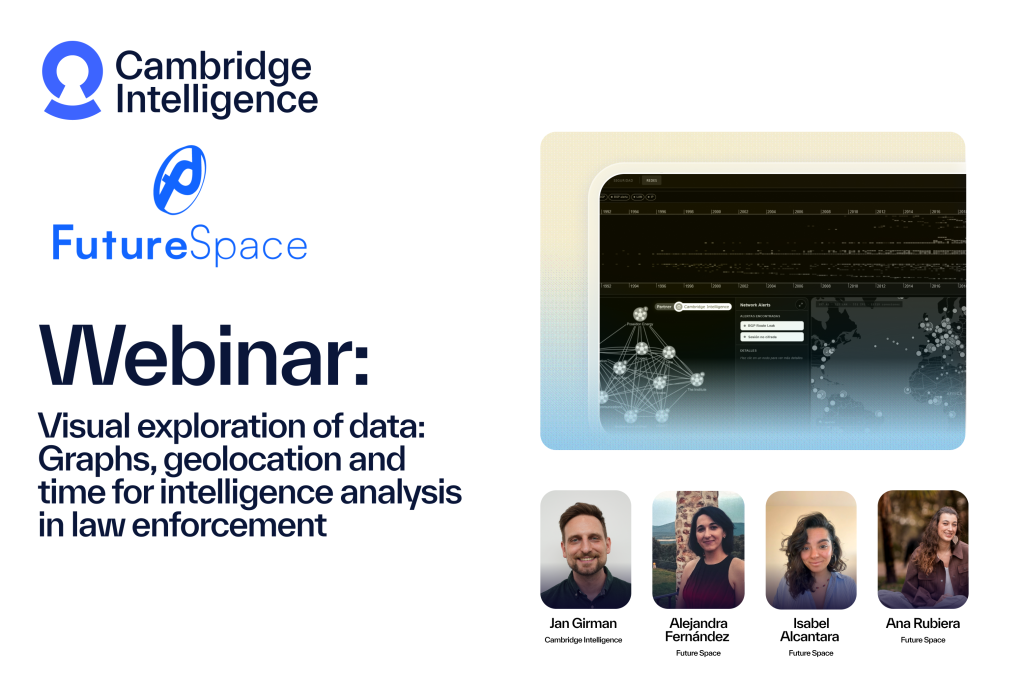
In this webinar, co-presented with Blackdot Solutions, we show how visual link analysis helps analysts to:
- Overcome data silo challenges
- Get a 360-degree view of complexity
- Focus on the data that matters
Want to learn more? Our ultimate guide to graph visualization explains everything you need to know to get started.
Explore our graph, timeline, geospatial visualization resources
Share: