This release delivers the fastest KeyLines yet, thanks to major improvements to our WebGL rendering performance.
We’ve also made it easier to manage your KeyLines lifecycle, revised our Vue framework offerings, and created a brand new anti-fraud demo.
WebGL frame rates improved by 50%
We know that performance is key when you’re building a data visualization app. To speed things up, we’ve significantly improved our WebGL rendering performance. During benchmark testing, we’ve seen a 50% increase in frames per second compared with earlier releases.
Simpler, cleaner lifecycle management
We’ve added the option to create a parent container for elements, giving you much better control over the lifecycle of your KeyLines component.
The container provides plenty of benefits. To stop KeyLines wasting memory and other resources when you’re not using it, you can now use ‘destroy’ functions to remove elements quickly and cleanly from your app. It also makes it much easier to move and hide charts and time bars around, or reassign them if you’re switching tabs in a single page app.
Another bonus – component resizing can be performed automatically, so there’s no need to write complex custom code. It just works.
Better experience for Vue developers
In the last release we rewrote the Angular, React and plain JavaScript quick start guides and updated the relevant components. This time it’s Vue’s turn.
You’ll find an updated tutorial to get your integration off to a quick start, and a Vue component that’s more useful and consistent.
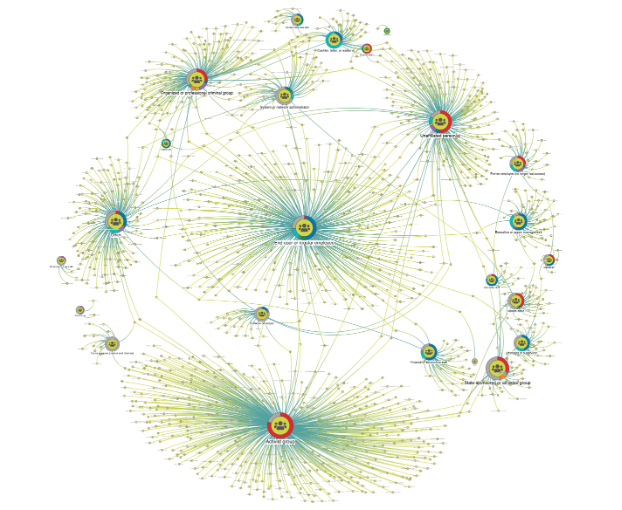
New demo: Insurance Fraud Analysis
Our latest demo shows how visualizing data can help to analyze potentially fraudulent insurance claims.
The Insurance Fraud Analysis demo features a large dataset and multiple views so you can drill down into suspicious activities, carry out social network analysis and explore map-based data.
It’s just one of over 70 demos available from the KeyLines SDK site.
Enhancements & fixes
You’ll also see fixes and other improvements, including:
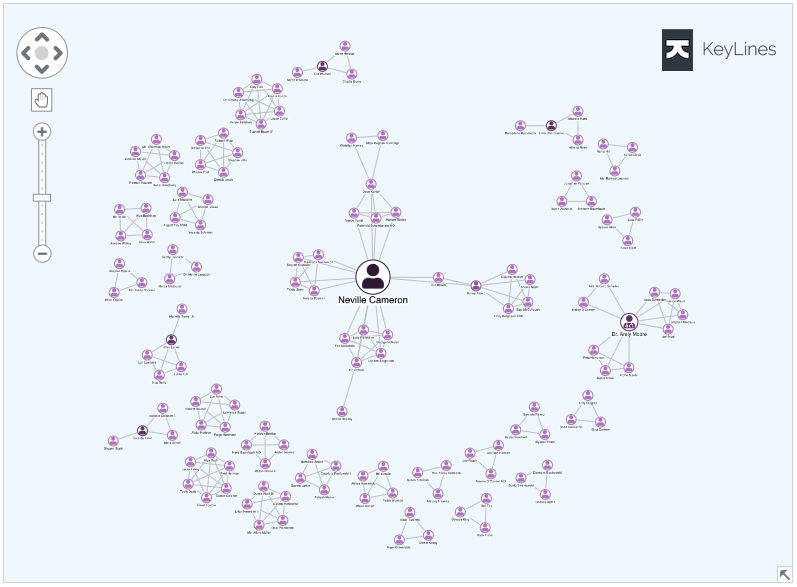
- better use of screen space by our organic layout, plus a tightness option for finer control over node spacing
- improvements to our lens layout and combo arrangement when handling a mix of different sized nodes
- the ability draw font icons in glyphs inside bubbles
Want to try 5.3 for free?
As ever, you’ll find more details in the release notes on the KeyLines SDK site. And if you’re not already a KeyLines user, request a free trial to start your graph visualization journey.


