FREE: Buyer's guide to graph visualization
This practical guide to choosing the right technology for your project includes a handy comparison template.
Choosing a graph visualization partner is a big commitment. You need to find a provider whose technology is right for your users and your data; and who’s a good fit for a long-term partnership.
Previously, we’ve compared open source code libraries with commercial visualization SDKs to show you why an SDK is the obvious choice for your project.
This time, we’ll look at the six high-level questions you should consider when choosing a graph visualization partner, to make sure they’re up to scratch.
Having a developer-friendly API makes a huge difference to the success of your project. Lots of developers turn to us after spending months trying to hack with other, less user-friendly options. With us, they make more progress in a few hours than they previously achieved in a few weeks.
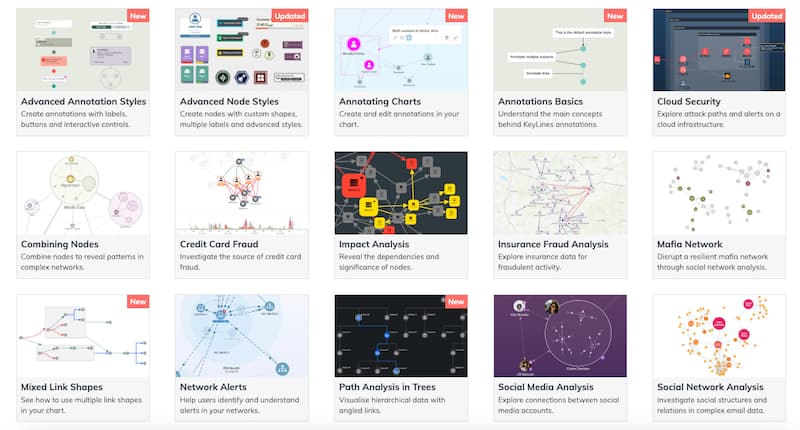
We know how important it is to ensure great DevX. That’s why we worked so hard on our interactive live coding environments – we call them “playgrounds”, but they’re not just for fun. You can use them to write or paste an app into your browser, experiment with it and see the results instantly.
And don’t forget to check out the documentation – is it easy to search and understand? We know that everyone has a different learning style, and text-based documentation isn’t always enough. So alongside our playground, we provide demos and example code snippets, to help developers who are visual learners and to save them coding from scratch.
Quality is an important aspect to bear in mind. Has the technology been tested in production by plenty of other organizations? Do they fix issues quickly?
We’ve worked with pioneering startups, Fortune 500 companies and national governments, and over the years we’ve built a solid understanding of what our customers need.
Our talented developers never stop working on new features for our SDKs, and we regularly release updated versions. This keeps us compatible with the latest technologies, and ready to support every innovation our customers bring to us.
See our customer success stories
When it comes to functionality, our customers’ needs vary greatly depending on their users, data, use case and so on. That said, certain points come up repeatedly, such as:
Device and browser support: One of the challenges of building web applications is making sure they work across all your users’ devices and browsers. We’ve made sure that our toolkits support the most widely used options.
Compatibility: A good graph visualization partner supports your chosen database or framework. Our KeyLines SDK supports whatever JavaScript framework you prefer, and our ReGraph SDK is designed for React applications. Both toolkits support popular graph databases including Neo4j, Titan and JanusGraph. This gives you the freedom to build your web application in a way that suits you.
Layout and animation: Layouts untangle your data, making graphs more useful and insightful. They also enable positions and styling of the chart to be smoothly animated from one state to another, providing greater clarity.
Drawing: Customizing and styling your application helps it stand out in a competitive market. With our SDKs you can style and decorate chart elements to match your application’s look and feel, conveying critical information about the underlying data without overwhelming the user.
Clutter reduction: Trying to analyze a clump of data is extremely difficult. We’ve developed clever ways to eliminate clutter from charts and help you extract maximum insight. Along with layouts, our most popular features are:
Time visualization: Time is a crucial dimension to graph data. Our time bar allows you to filter your network through time and understand how it has evolved. If you’d like to enhance your application with interactive timeline visualization, check out KronoGraph.
Geospatial visualization: When visualizing connected data on maps, you need to bring the geographic location to life without losing sight of the connections that make it important to your investigation. If you need a geospatial view of a network on a map, our map mode layout is quick and easy to implement.
Developing an application from scratch can be challenging. With the right graph visualization partner, it doesn’t need to be. We’ll give you the support and guidance you need to create the best possible applications.

Our technical support channel is managed by the software developers who build our products, so you’ll get expert assistance. If you need extra help, our commercial development team is on-hand. They can help with everything from application review sessions to functionality deep-dives and 1-2-1 workshops.
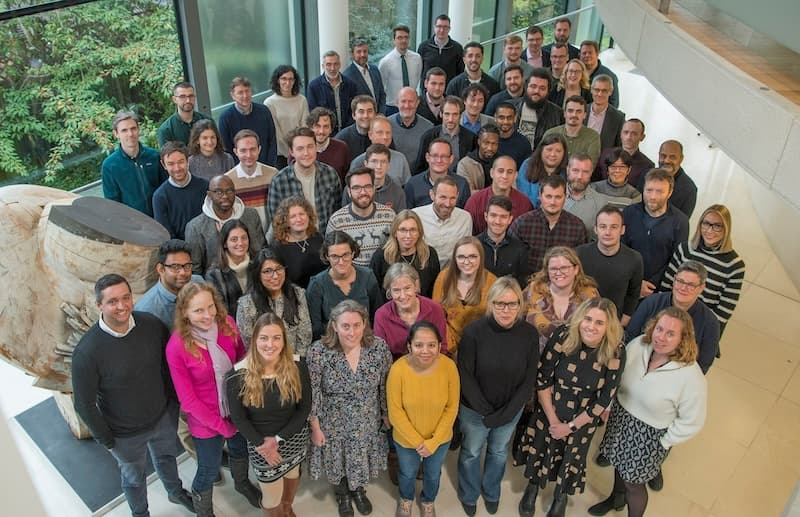
We’ve been helping customers visualize complex data since 2011, so we have a huge amount of expertise to share. From the initial application design and prototyping to deployment and maintenance, we’re here to help.
The software landscape is always evolving. Look for a visualization partner that’s evolving at pace, and will be able to keep your technology up-to-date with the latest trends and innovations.
Our product managers are constantly looking for ways to improve our toolkits with new and enhanced features. With our sole focus being the visualization of graph data, all of our resources go towards maintaining, supporting and improving our products.

With a long-term business relationship, you need to make sure your values and goals are aligned; and along with that, you need transparency and active communication.
It’s important for us to engage with our customers, understand their challenges and work with them to find solutions. The Connected Insights series is a great example of how we do this. It was launched in 2017 to drive innovation and share knowledge among graph visualization practitioners. It’s a hub for inspiration, support and advice, giving members insights into best practice, and updates on our roadmap. Through Connected Insights we’re working to define and build the next generation of connected data visualization tools.
And beware of graph visualization partners prone to radical changes of direction, or sudden incompatibility with the technology you’ve chosen to use. Over 250 customers across 30 companies across 6 continents already rely on our technology and expertise, so you can trust us to support you throughout your graph visualization journey. Discover more about us and our team

We’ve covered just some of the criteria you should consider and benchmark when making a decision. The best way to choose a graph visualization partner is by trying the technology for yourself.
Discover how our SDKs can power your connected data visualization application by requesting a free trial below.