KeyLines 6.0 featured the biggest overhaul of our underlying events engine in the toolkit’s history.
This blog explores the reasons why we made this investment and showcases how you can use the new API to customize your applications like never before.
Why events?
Some visualizations stand alone as beautiful and insightful static images. But for the most part, a visualization without interactions is never going to be as helpful as one you can manipulate and play with, particularly when you’re dealing with complex connected data.
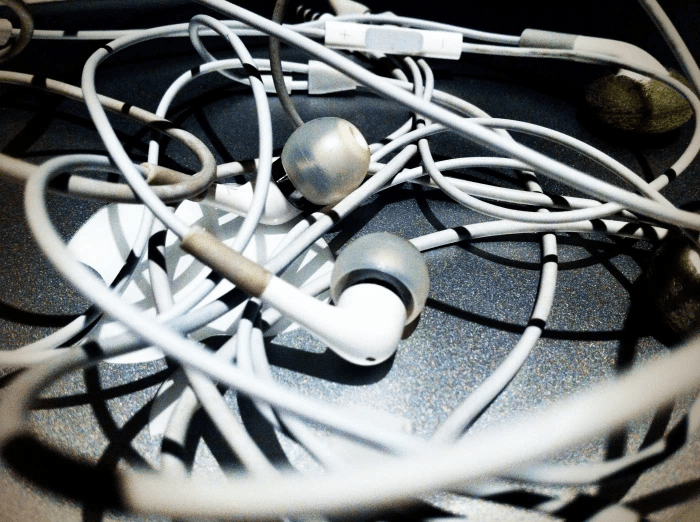
Here’s a helpful analogy: think about a tangled pair of headphone wires. If you ask someone to untangle them, you’ll see what I mean. Nobody will just look at them from a distance to work out what to do. They’ll pick them up, rotate them, see them from different angles, move bits around, up and over each other as their brains process the complex hairball of information. And, bit by bit, as their mental picture of the situation becomes clearer, their movements become more certain, and they’ll quickly solve the problem.
This is the way people work, and it’s why we take chart interactions very seriously. And beneath chart interactions lies our events engine, which processes the clicks, drags, zooms, keyboard inputs and other gestures users make as they explore and play with their connected data.
Let’s look at three guiding principles behind our new events engine and show you some of the demos we built to illustrate why they are so powerful.
Listen more often
As well as clicks, double-clicks and hovers, events also tell you when things have moved or changed. The new events engine in KeyLines 6.0 includes view-change, selection-change, pointer-move and drag-move events which fire continuously as the user interacts with the chart. If you attach handlers to them, you can respond with fine-grained accuracy to what they are doing.
Imagine if you want to annotate or decorate the chart with your own custom HTML, and want it to follow the positions of nodes as the user moves them or changes the view. The drag-move and view-change events give you all the information you need to update your annotations.
Another example is when you’re writing custom code to display selected nodes differently depending on their type. Say we wanted green nodes to get a green border when selected, but purple nodes to get a purple border. I need to be able to re-run that custom code continuously as the user selects an area of the chart with a marquee. The new selection-change event allows me to do just that.
Don’t want such responsive behavior? You can always use a throttle or debounce function to limit the number of times your handler is called. There are code examples on the KeyLines SDK site of how to do this effectively.
Evaluated our toolkits yet?
Access the API library, demos, downloadable code and more.
Prevent defaults
Every KeyLines event comes with default behaviors. Dragging a node will move it; double-clicking the background will zoom in, and so on.
New preventDefault() and setDragOptions() methods allow you to override these defaults and get the behavior you want. Here’s a really simple example – say you wanted a mode where attempting to drag a node would instead pan the whole chart. This is now as easy as:
chart.on('drag-start', ({ setDragOptions }) => {
      setDragOptions({ type: 'pan' });
});
But you can go a lot further than this. Here’s a demo one of our developers put together which overrides the standard movement of dragged items (by calling preventDefault() from the drag-move event) so that you can add your own constraints to the motion. In this case, we’re snapping nodes to a grid drawn in the background. The grid itself moves and adapts to your view thanks to that view-change event we mentioned earlier.
Exploit the wealth of new gesture data
Every event in KeyLines 6.0 comes with supporting contextual information to help you understand what’s happening, from pointer types (pen, touch, etc.) to keyboard shortcuts and modifier keys. Want to let users select nodes with a left-drag but pan the chart if the CTRL key is held down? It’s as simple as:
  chart.on('drag-start', ({ modifierKeys, setDragOptions }) => {
    if (modifierKeys.ctrl) {
      setDragOptions({ type: 'pan' });
    }
  });
Now here’s the ultimate test of events – build an app to let users draw their own graph visualizations using any combination of mouse, pen and touchscreen. Our developer Adrian rose to the challenge.
Try it and see
Your users should never have to think about an underlying events engine. The tools they use should ‘just work’, in an intuitive way that lets them gain fast insight from the networks of connected data you provide them with. A good events engine gives you this user experience – without anyone realizing it’s there.
The new events engine is the result of a huge team effort here at Cambridge Intelligence. We’ve worked on feedback from our customers who’ve helped us design an events system that we think is powerful enough to handle anything you can throw at it.
And if you’re using ReGraph, our React graph visualization toolkit, you’ll also benefit from high fidelity events to make your application stand out.
If you’d like to take up the challenge, you can request a free trial.


