This page is from our blog archive
It’s still useful, but check out KeyLines architecture for more up-to-date info.
Before getting stuck in with a KeyLines evaluation, many of our customers have questions about how everything works under the hood.
For this KeyLines FAQ, we thought we would get a KeyLines developer to answer the top 10 questions we get asked by new customers about KeyLines’ Architecture.
Feel free to add any other questions in the comments section!
10. Can I write my own layout?
Yes! You can write your own layouts, if our ones don’t fit your requirements. KeyLines gives you complete control over the x,y positioning of nodes, as well as allowing you to animate position changes to help the user understand how a layout is repositioning the network.
9. Can I write back changes to my database
Sure. This requires just a simple change to your customization code (the part of the code that defines what happens when the user interacts with the network).
The Neo4j demo in the SDK includes source code giving examples of how to do this (but the approach works with any database).
8. How large a chart can you create?
We’re often asked about the largest size chart that KeyLines can display, but in general the answer is that displaying thousands of nodes and links – which KeyLines can certainly do – does not often make an effective visualization.
In performance experiments with our WebGL renderer we have created KeyLines charts with several hundred thousand nodes, but you really don’t want to do this in a practical visualization. The number of nodes can quickly become visually overwhelming and doesn’t provide effective insight into your network data. This post explains further: how to visualize large networks.
7. Can I load a huge network, but only show small parts at once?
Yes, this is a good approach to working with a very large network.
KeyLines will happily load networks containing hundreds of thousands of nodes into the client memory and show/hide certain subsets of the data on demand. Again, the SDK has examples of this – see the ‘Filters’ demo.
6. Why run analytics client-side if it only works on the subset of data in memory?
Remember, you can hold a lot more graph data in the memory than is feasible to show. Analytics will run in all of that data, not just the subset on screen.
This means you get the very direct and interactive experience the user wants, without having to constantly go off to the server to retrieve analysis results.
5. Can I pass the data back and forth encrypted?
If you need to, yes you can. Because KeyLines is a client-side component, it gives you the flexibility to design the client-server relationship the way you want it, so you can use SSL or other security mechanisms to protect the data as it travels between server and client.
4. What is the server performance like?
The only direct impact that KeyLines has on server performance is the need to download the component to the browser when the page that uses KeyLines is first loaded.
Typically the KeyLines files will stay in the browser’s cache after first use. The main KeyLines JavaScript file is less than 200k – around twice the size of minified jQuery.
3. How secure is KeyLines?
Basically, it is as secure as you need it to be.
As a client-side JavaScript component it’s benefiting from the browser’s sandbox and doesn’t have any server-side dependencies. The result is it’s entirely self-contained inside your firewall.
2. How do I add all those other cool UI elements that you have in your demos to my code?
KeyLines doesn’t have any dependencies on third-party components – all you need to run it is a browser. Having said that, it is a “good JavaScript citizen” and can coexist with the vast range of other JavaScript libraries that are available. We do use some of these in our demos, particularly JQuery (jquery.com) and JQuery UI (jqueryui.com) for UI elements. You can inspect the demo page source in the SDK for more details.
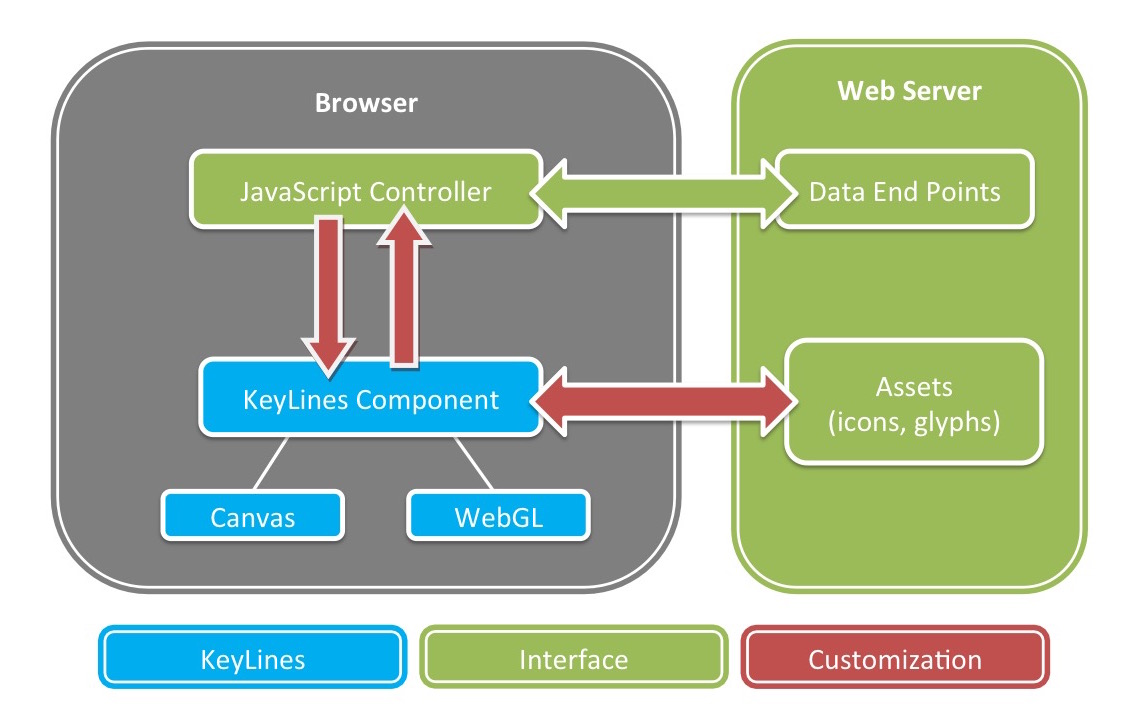
1. How do I get data from the database into KeyLines?
This is our most asked question! It’s also one of the vaguest… Hopefully, this will help:
KeyLines is a JavaScript component that exposes a JavaScript API to allow you to create and modify network charts, and respond to user interactions with them. To get network data into KeyLines, you write JavaScript customization code that simply calls one of the API functions that the KeyLines component exposes, passing in a JavaScript object that represents the nodes and links you want to create.
The required object format is documented in detail in the SDK.
How you get the data from the database into the KeyLines format is up to you – which gives you a great deal of flexibility in designing your architecture.
Some KeyLines users are using traditional relational databases; others are using graph databases like Neo4J or Titan; others are using different NoSQL database approaches. The SDK includes examples of how to work with different databases, along with full source code.
Getting Started: How to visualize the Neo4j graph database
Working with a Neo4j graph database? You can find more details on how to connect to KeyLines in our Neo4j graph visualization tutorial.


