This page is from our blog archive
It’s still useful, but it’s worth checking out this page on building with KeyLines for more up-to-date info.
 One of the best things about KeyLines is its customization. Every aspect of a KeyLines application can be adapted to meet the needs of your users, and the peculiarities of their data.
But KeyLines is also incredibly extensible. With some JavaScript knowledge and a little bit of work, you can integrate 3rd party libraries or build your own functionality to run alongside native features.
The KeyLines toolkit includes six layouts, but there are endless ways of laying out a network – so you might want to implement one of your own.
In this blog post we take a quick look at how you can get started with building your own layout algorithm, defining a neat framework for your code and explaining the best practice approach.
Step 1: Build the foundations
We’ll start simply with an empty JavaScript file, called newLayout.js. Later on we will import this into our webpage.
Next we’ll create a function, called newLayout, to go into our empty file:
function newLayout(chart){
 // Here we will write functions that are required to perform the layout
 // Such as copyInformationFromGraph and updateGraph

  function layout(){
	// The code written here will be executed when the user writes
	// var myLayout = newLayout(chart);
	// myLayout.run();
 }

 return {run:layout};

}
Step 2: Copy the data into local tables
The next step is to implement a function that copies our graph data into local tables. We do this using the function copyInformationFromGraph(). This will store our node data in ListNodes.
We could just work directly on our local variables (using chart.getItem followed by chart.setProperties) but this approach is cleaner and more efficient.
var listNodes; // add listNodes as a global variable defined in newLayout !
 function copyInformationFromGraph(){
   listNodes= [];
   chart.each({type:'node'}, copyItem);

   function copyItem(item){
     if(item.hi){
       return;
     }
       listNodes.push({id:item.id, x:item.x, y:item.y});
     }
   }
Step 3: Modify the coordinates
Once we have all the information in listNodes, our layout code will modify their coordinates values, which dictate where they appear on the chart. A function called updateGraph will update the chart once the layout is complete:
function updateGraph(){
   var listChanges = [];
   var k;
   for(k=0; k < listNodes.length; k++){
     listChanges.push({id:listNodes[k].id, x:listNodes[k].x, y:listNodes[k].y});
   }
   chart.animateProperties(listChanges);
 }
Step 4: Write your custom layout code
Now it’s up to you to write your own layout code in the function layout.
For example, to build a simple layout that displaces nodes randomly, just insert the following code in the function layout():
copyInformationFromGraph()
for(var k=0; k < listNodes.length; k++){
 listNodes[k].x += 10*(0.5 - Math.random());
 listNodes[k].y += 10*(0.5 - Math.random());
}
updateGraph();
Step 5: Run your layout
Simply:
var myLayout = newLayout(chart);
myLayout.run();
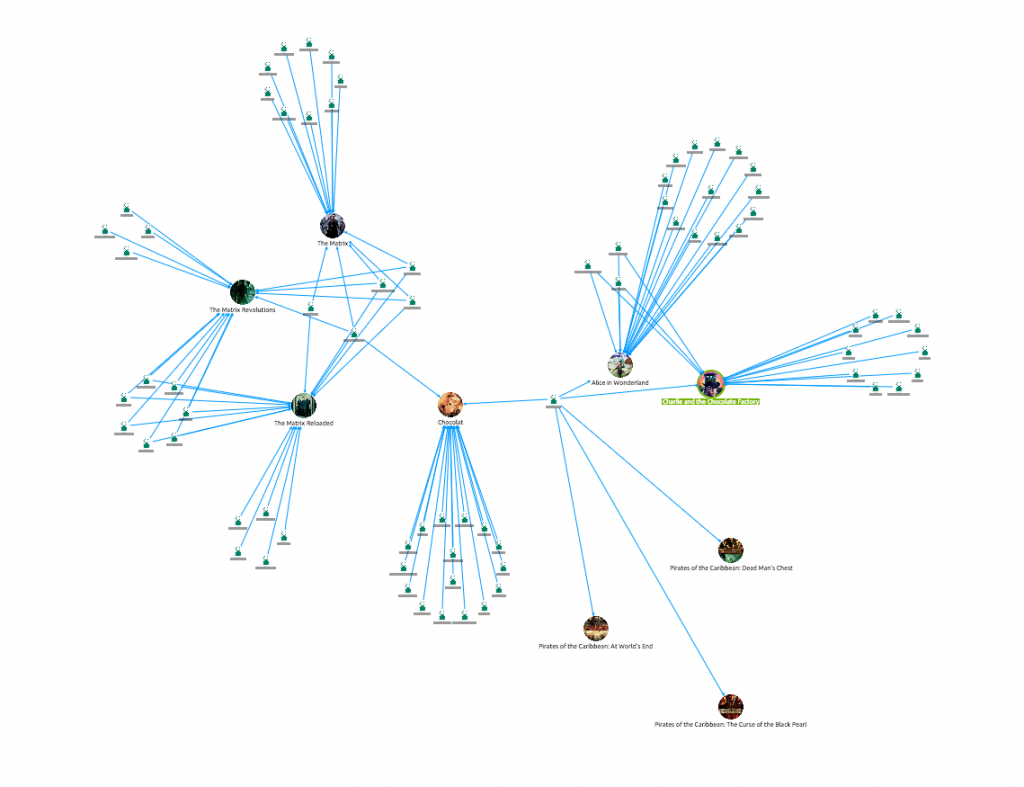
And the result:
Getting more adventurous…
Now we have our basic framework in place, we can try some more advanced operations.
In the spirit of the force-directed layout let’s write a layout that will compute electric forces between nodes.
The value of the force along the x-axis and the y-axis will be stored in listNodes (listNodes[k].fx and listNodes[k].fy).
A function called computeElectricForces will compute the value of these forces and a function applyForces will update the coordinates of the nodes accordingly.
Our new code looks like this:
function newLayout(chart){
var listNodes;
  function copyInformationFromGraph(){
   listNodes= [];
   chart.each({type:'node'}, copyItem);

   function copyItem(item){
     if(item.hi){
       return;
     }
       listNodes.push({id:item.id, x:item.x, y:item.y, fx:0, fy:0});
   }
 }

 function updateGraph(){
   var listChanges = [];
   var k;
   for(k=0; k < listNodes.length; k++){
     listChanges.push({id:listNodes[k].id, x:listNodes[k].x, y:listNodes[k].y});
   }
   chart.animateProperties(listChanges);
 }

 function computeElectricForces(){
   var k1, k2;
   var coefficient = 2*1e5;
   for(k1 = 0; k1 < listNodes.length; k1++){
     for(k2 = 0; k2 < listNodes.length; k2++){
       if(k1!==k2){
         var deltaX = listNodes[k1].x - listNodes[k2].x;
         var deltaY = listNodes[k1].y - listNodes[k2].y;
         var r = Math.sqrt(deltaX*deltaX + deltaY*deltaY);
         var forceStrengh = coefficient / (r*r);
// r is the distance between two nodes. In order to project the force along the x-axis and the y-axis
// we multiply forceStrength by (deltaX / r) and (deltaY / r) which correspond to the cosine and
// the sine of the angle between the two nodes and the x-axis and y-axis
// Notice that if r = 0, i.e. if two nodes are stacked, then our code does not work: it’s up to you to
// find a solution for that (for example, shaking the nodes’ positions if such a case occurs)

         listNodes[k1].fx += forceStrengh*(deltaX / r);
         listNodes[k1].fy += forceStrengh*(deltaY / r);

       }
     }
   }
 }

 function applyForces(){
   var k;
   for(k = 0; k <listNodes.length; k++){
     listNodes[k].x += listNodes[k].fx;
     listNodes[k].y += listNodes[k].fy;
   }
 }

 function layout(){
   copyInformationFromGraph();
   computeElectricForces();
   applyForces();
   updateGraph();
 }

 return {run:layout};

}
When this layout is applied to the same graph, we get the following result:
Further improvements
Our algorithm is still pretty basic here. There are plenty of ways to improve it, for example:
- Using spring-like forces between connected nodes, pulling them back into each other
- Including a loop to compute positions and update the network accordingly
- Using forces to modify the speeds of nodes, rather than their positions.
A huge number of other improvements have been developed by the graph drawing community. We’ll make sure we follow this post up with some of them soon!
Try it yourself
Do you have a great idea for a layout? Get creative and try it for yourself!


