This page is from our blog archive
It’s still useful, but it’s worth checking out this page on building with KeyLines for more up-to-date info.
Getting data into KeyLines
This is one of a series of posts answering frequently asked questions we hear from new customers.
A question a lot of developers ask us, usually early in their exploration of KeyLines, is how they can get data into their application.
The short answer to this is, pretty much any way they want.
A database-agnostic visualization tool
The KeyLines SDK is database agnostic and flexible enough to work with virtually any database. We have customers using a whole range of different datastores, including:
- Graph databases, like Neo4j and Titan (see how to build a Neo4j graph visualization)
- NoSQL databases, like MongoDB and CouchDB
- Relational databases, like the Oracle databases
- Triple stores
- Even just pulling data from memory
This freedom is a result of KeyLines’ extremely flexible architecture.
Essentially, how data gets into KeyLines is entirely up to you – as long as your data is in a format that can be put into a node-link model, it can be parsed into KeyLines required format (a JSON object).
The standard process is:
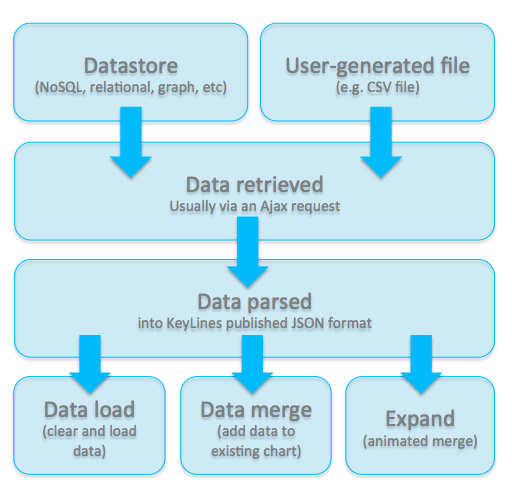
Step 1 – Data loaded into data store
The data is loaded into your preferred datastore, or supplied in a user-generated format, such as a CSV file.
Step 2 – Data is retrieved
There are several ways to retrieve the data. Most of the time, this happens via an Ajax request, which calls the REST/SOAP API. If the data is in a file, one way to get it into KeyLines is using HTML5 drag & drop.
Step 3 – Data is parsed
The data then gets parsed into KeyLines’ JSON format, which defines the data as a list of nodes, links and their attributes.
Step 4 – Data is loaded into the KeyLines chart
- If the chart is empty, all the data is loaded
- If you’re adding data to an existing chart, data is merged in
- If you’re calling data to expand the network, data is added and animated
It’s that simple. To see some relevant code snippets, take a look at some of our earlier blog posts.


