Building with KronoGraph
Timeline visualizations that drive investigations
What is KronoGraph?
KronoGraph is a JavaScript software development kit (SDK) for building interactive timelines. You do this by creating timeline visualization components that are easily embedded in your own web applications.
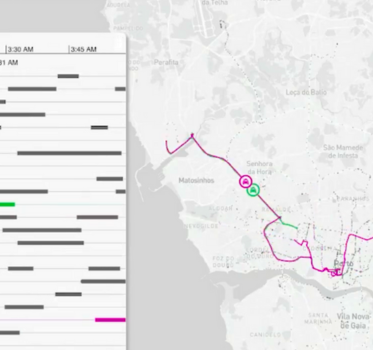
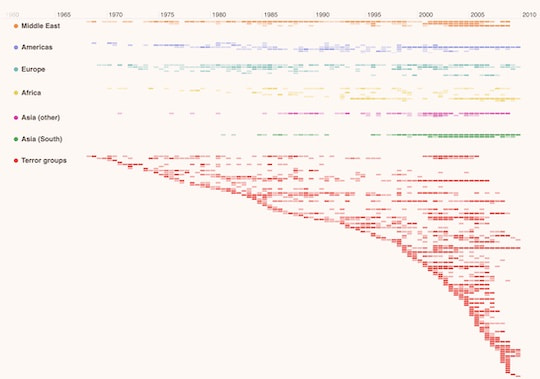
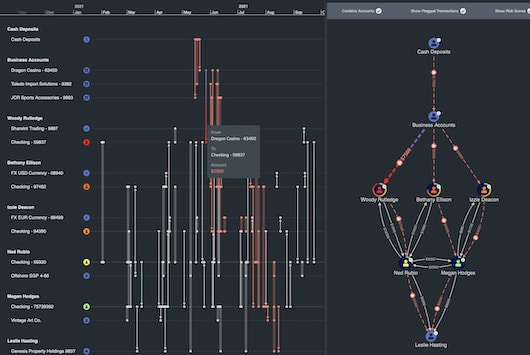
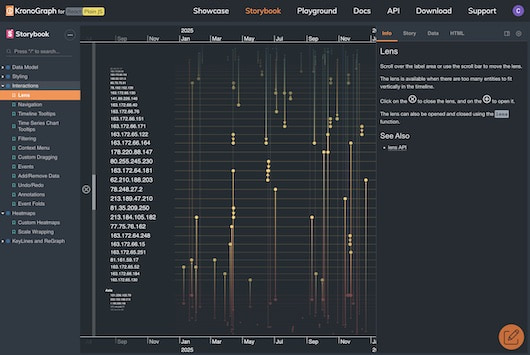
With its heatmap view and intelligent data aggregation, KronoGraph scales beautifully whether you have ten events in your timeline visualization or 100,000. Users can combine thousands of timelines into a single visualization, and use the lens view to explore every individual timeline in context.
With an SDK site full of practical resources and the team behind KronoGraph’s development on hand to offer support, you’ll quickly create timeline visualization applications that’ll help users understand the most complex event sequences.
Why Build with KronoGraph?

Works with any time-based data
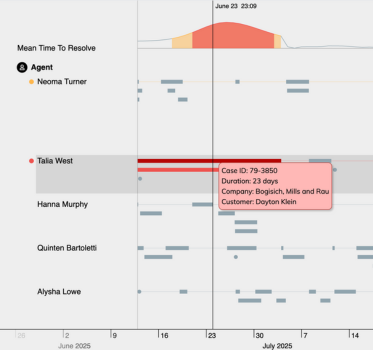
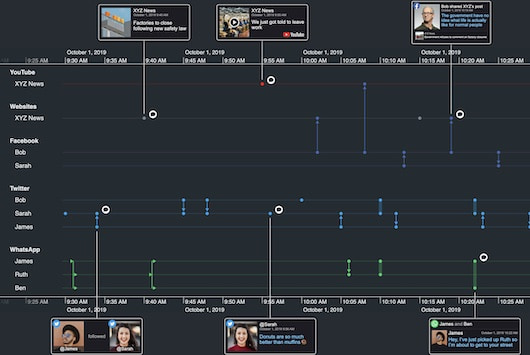
Use any combination of data source you like. As long as it contains timestamps or durations, KronoGraph can visualize every entity, event and connection.
You get complete control over how it looks and the way every interaction works.

Performance & scalability
KronoGraph handles your largest datasets easily without demanding huge resource from your system.
Users benefit from fast, intuitive data aggregation in a timeline visualization that looks good at every scale.
Seamless integration with our SDKs
KronoGraph works as a standalone tool or integrated seamlessly with KeyLines and ReGraph, our graph visualization SDKs. Less time wasted on integration means your users get two powerful views of their data even faster.
Expert help & support
The quality of our documentation matches the quality of our code. There’s a detailed API library to make building your application much easier.
The KronoGraph SDK site also features showcase demos to kickstart your timeline visualization designs.
Choose JavaScript or React
KronoGraph has a plain JavaScript API which you can adapt to any framework. There’s also a React component that you can quickly and easily drop into React applications. Whichever you choose, both come with optional TypeScript support.
Need more info? Get in touch
Works seamlessly in any environment
KronoGraph is a front-end application that slots easily into your existing environment. You can host it wherever you like without having to adapt your current setup.
There’s no requirement for expensive visualization servers when you’re running KronoGraph. It works with nearly every datastore, providing the freedom to connect to your repository of choice. And if extra security is important, simply configure a secure SSL channel between server and web browser.
A robust API
With a fully-documented API designed by visualization experts, you have fine-grained control over every timeline visualization function, option and event.
Through the development of our existing toolkits, we have a proven track record in providing major organizations with reliable data visualization technology through frequent release updates.
Watch our developer webinar: Visual timeline analysis + graph applications
Expert support and guidance
The KronoGraph SDK is packed with useful resources including demos showcasing beautiful timeline visualizations, getting started guides, Storybook tutorials with example code, and a live code editing playground.
If you need technical support, the team that built the KronoGraph toolkit is on hand. Should you want to take support to the next level, we can help with everything from project review sessions to 1-2-1 workshops with our commercial development team.
How the API works
Step 1: Download KronoGraph
Use Yarn or NPM to add it to your project. You can also make use of our React component and TypeScript definitions.
Step 2: Connect to your data source
Choose whatever source of time-based data you want, or overlay multiple datasets.
Step 3: Add interactions & styling
Get inspiration from demos and use intuitive APIs to design the interactions your users need.
Step 4: Integrate with KeyLines or ReGraph (optional)
Seamless integration with our graph visualization toolkits gives users powerful options for driving chart and timeline analysis.
Ready to try KronoGraph?
Coding with KronoGraph is easy. Throughout the KronoGraph SDK site there’s downloadable code – both plain JavaScript and React – to help get you started.
JavaScript example:
//     Copyright © 2011-2021 Cambridge Intelligence Limited.
//     All rights reserved
//     Sample Code - Using JavaScript to create a basic timeline visualization.

// index.js
import { createTimeline } from 'kronograph';

const timeline = createTimeline('my-timeline');

const timelineData = {
    entities: {'Person 1': {} , 'Person 2': {} },
    events: {
        'Phone call 1': {
            entityIds: ['Person 1', 'Person 2'],
            time: new Date(2020, 6, 1, 12, 0),
        },
        'Phone call 2': {
            entityIds: ['Person 1', 'Person 2'],
            time: new Date(2020, 6, 1, 13, 0),
        },
        'Phone call 3': {
            entityIds: ['Person 2', 'Person 1'],
            time: new Date(2020, 6, 1, 14, 0),
        },
    },
    type: 'Timeline',
};

timeline.set(timelineData);
React example:
//     Copyright © 2011-2021 Cambridge Intelligence Limited.
//     All rights reserved
//     Sample Code - Using JavaScript to create a basic timeline visualization.

// App.js
import React from 'react';
import Timeline from 'kronograph/react/Timeline';

const data = {
  entities: { 'a': {}, 'b': {} },
  events: {'a-b': { entityIds: ['a', 'b'], time: 1525000000000 }},
};

function App() {
  return (
    <div style={{ height: '100vh' }}>
      <Timeline entities={data.entities} events={data.events} />
    </div>
  );
}

export default App;
Trusted by developers
Our toolkits are the technology of choice for some of the biggest global organizations.


Any browser, any device
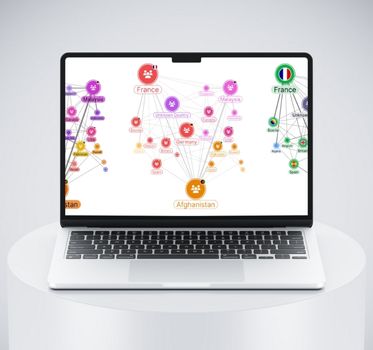
KronoGraph works in major browsers on a full range of desktops, tablets or cell phones.
Integrate with any datastore
KronoGraph works with any source of timestamped data that’s parsed into JSON format.
It works particularly well with graph databases, like Neo4j, but it’s also a good fit for other database types, log files and spreadsheets.