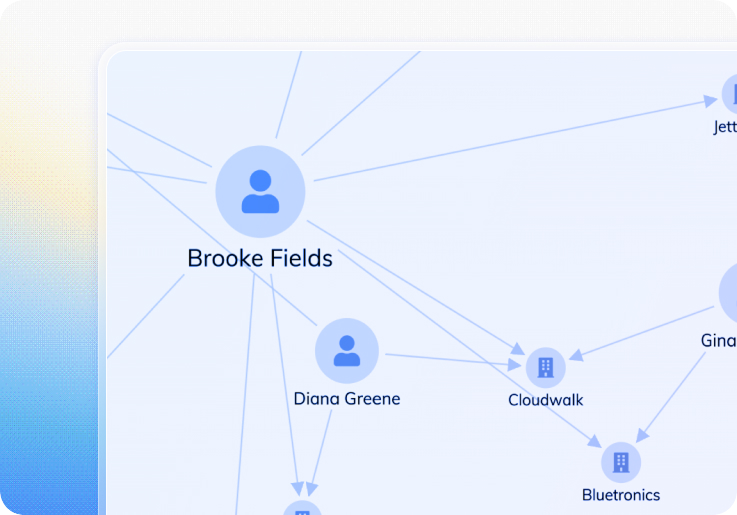
Link analysis

Unlock your connected data with powerful link analysis

What is link analysis?

Link analysis, sometimes called ‘graph visualization’ or ‘network visualization’, is the process of visually presenting networks of connected entities as nodes and links.

Typically, the nodes represent specific data points – people, organizations, events, locations, or devices – and the links represent the connections between them. These connections might be transactions, communications, movements, relationships, or any other form of association.

Combos

Why use link analysis?

Link analysis helps you understand connections, in a densely connected world.

Unlike other forms of data analysis, link analysis focuses as much on the connections between data as on the data points themselves. That makes it possible to uncover hidden relationships and identify patterns, like dependencies or anomalies, that aren’t visible in aggregated analysis.

If you need to understand connections in your data, there can be huge advantages to looking beyond your ‘flat’ data model with powerful link analysis tools.

It’s intuitive

Exploring networks as node-link structures instantly makes sense, even to people who’ve never worked with connected data before.

It’s fast

Our brains are great at spotting patterns, but only when the info is in a tangible format. Link analysis helps you identify trends and outliers quickly.

It’s holistic

Link analysis makes it possible to connect data points from diverse sources, breaking down silos for a holistic view of the full data context.

It’s scalable

Link analysis lets you simplify complexity, see context and understand detail. With one chart, you can get an overview or dive into specific connections.

It’s insightful

Through interactive data analysis, you gain deeper knowledge and understand context. That’s hard to achieve with a static, aggregated visualization.

Types of link analysis

Link analysis has evolved to support different analytical needs, from traditional network visualization to advanced geospatial and temporal analysis. Understanding which type fits your use case is critical to choosing the right tools and approach.

Traditional network link analysis

Traditional network link analysis focuses on relationships between entities without geographic or temporal dimensions. This is the foundation of link analysis and remains the most common approach for:

  • Entity relationship mapping – Understanding how people, organizations, and assets connect
  • Social network analysis – Identifying influencers, communities, and communication patterns
  • Fraud ring detection – Uncovering connected groups working together to commit fraud
  • Organizational structure mapping – Visualizing hierarchies and reporting lines
  • Cyber threat intelligence – Mapping attack patterns and malware propagation

Traditional link analysis excels when your primary questions are “who is connected to whom?” and “how are they connected?” rather than “where” or “when.” Learn more about link analysis techniques and explore current link analysis trends .

Geospatial link analysis
Geospatial link analysis: Link analysis on maps

Geospatial link analysis – also called spatiotemporal visualization when combined with time – takes network visualization to the next level by adding geographic context. Instead of viewing relationships in abstract space, you see them overlaid on real-world maps, enabling pattern-of-life analysis, location-based correlation, territory mapping, and proximity analysis.

Tools like MapWeave enable this fusion by visualizing entities from all sources on a single map, showing relationships between intelligence from different sources and correlating network analysis with geographic context.

And when you integrate timeline with map views using tools like KronoGraph, you can see how networks evolve geographically, correlate spatial patterns with temporal events, understand sequence, and detect anomalies – seeing who connected with whom, where, and when all in one integrated interface.

Read more about geospatial fusion intelligence and see how OSINT investigators use geospatial link analysis.

Link analysis use cases

Geospatial visualization

Law enforcement

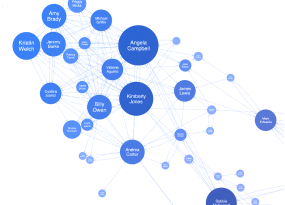
Visual link analysis platforms enable investigative teams to transform sprawling datasets into clear, actionable intelligence.

By revealing connections between people, places, events, and evidence, these tools help answer critical investigative questions that traditional methods might miss.

Applications include mapping organized crime structures, establishing chains of custody, recognizing repeat offender patterns, and discovering connections across separate investigations.

timebar

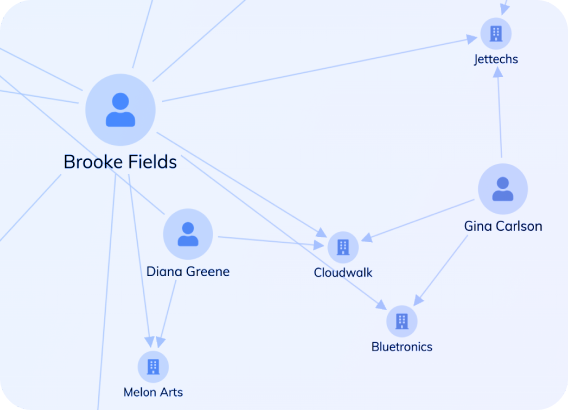
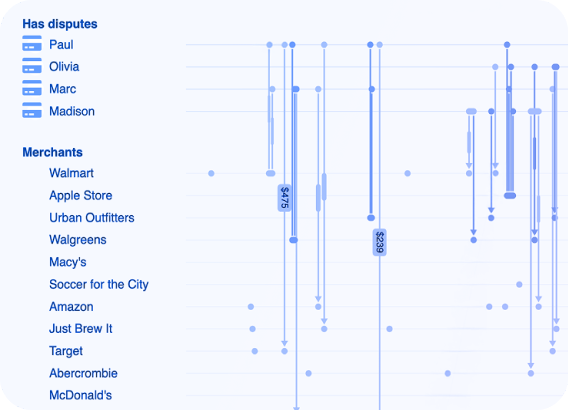
Fraud detection and anti-fraud

Sophisticated fraud schemes typically involve coordinated networks rather than isolated actors. Link analysis empowers investigators to expose organized fraud operations, identify fabricated identities built from stolen credentials, follow illicit fund movements across account networks, and spot suspicious activity patterns in their early stages.

These investigative techniques are used across financial services, insurance claims, healthcare billing, online gaming, consumer reviews, and misinformation tracking.

Credit card demo

Compliance and anti-money laundering (AML)

Complex financial relationships between entities, individuals, and organizations demand sophisticated visualization capabilities integrated directly into analyst workflows.

Link analysis accelerates pattern recognition and relationship mapping, enabling compliance teams to build stronger, more defensible risk assessment processes.

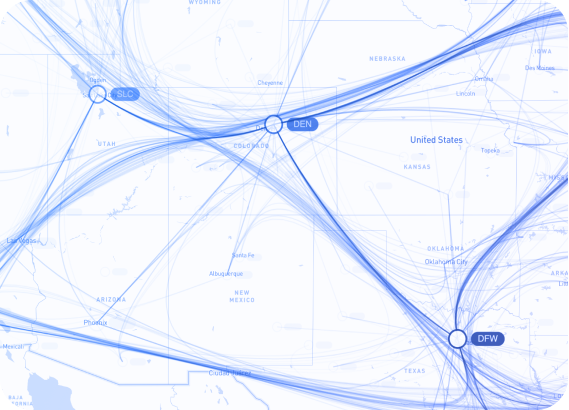
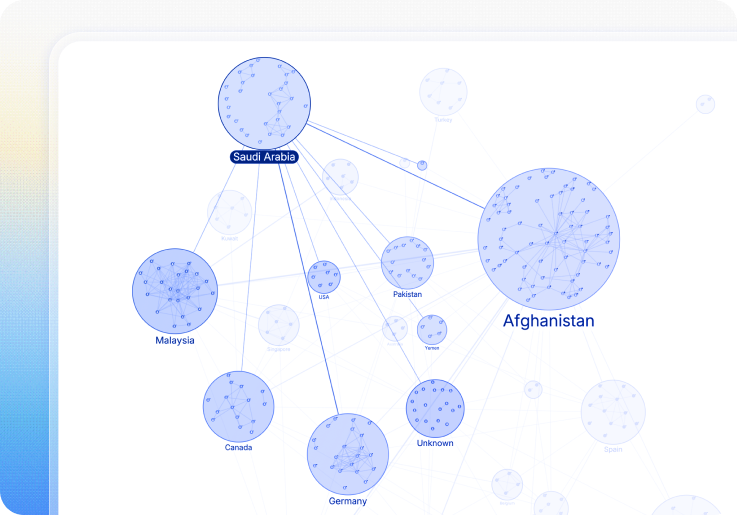
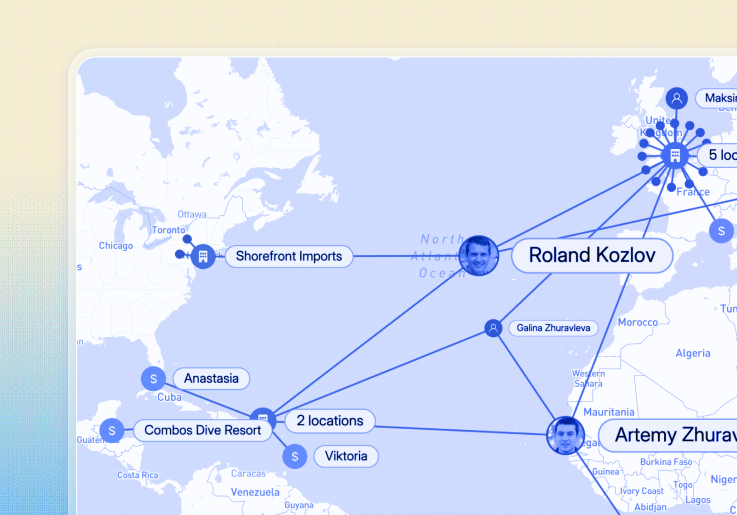
OSINT investigations

Publicly available intelligence sources present inherent challenges: fragmentation, noise, and sheer volume. Conventional analytical approaches often prove inadequate for extracting meaningful intelligence. Link analysis addresses these challenges directly.

Since OSINT work centers on mapping relationships among actors, organizations, and incidents across diverse data sources, network visualization provides an intuitive framework for analysis even in highly complex scenarios.

Curved links

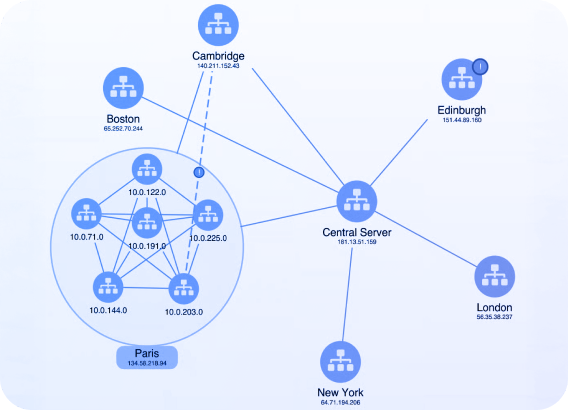
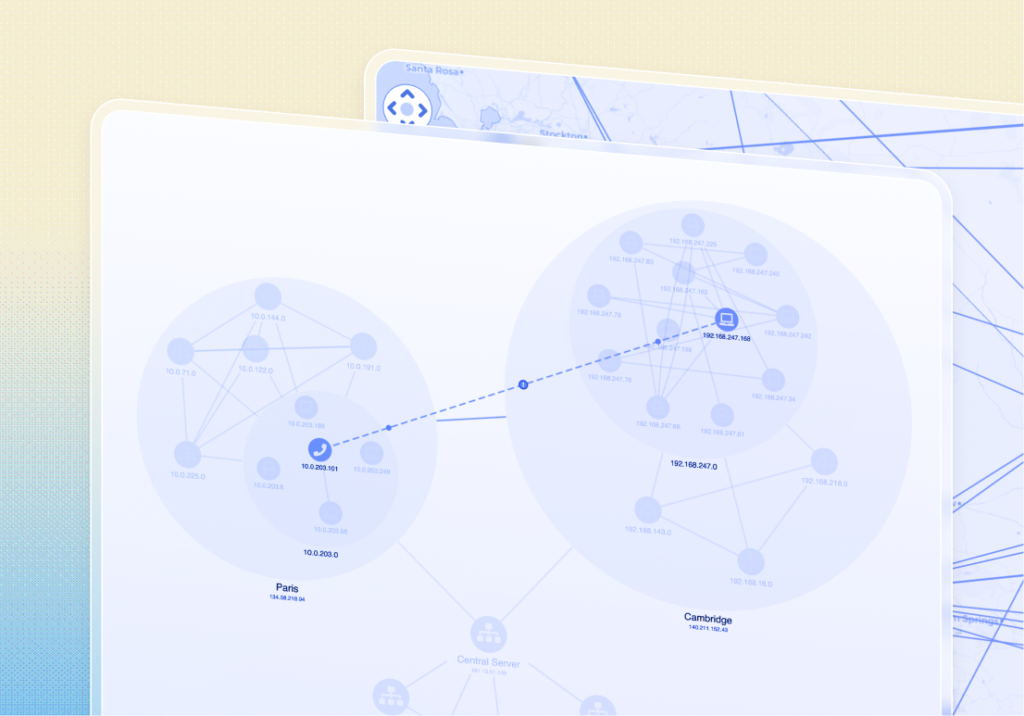
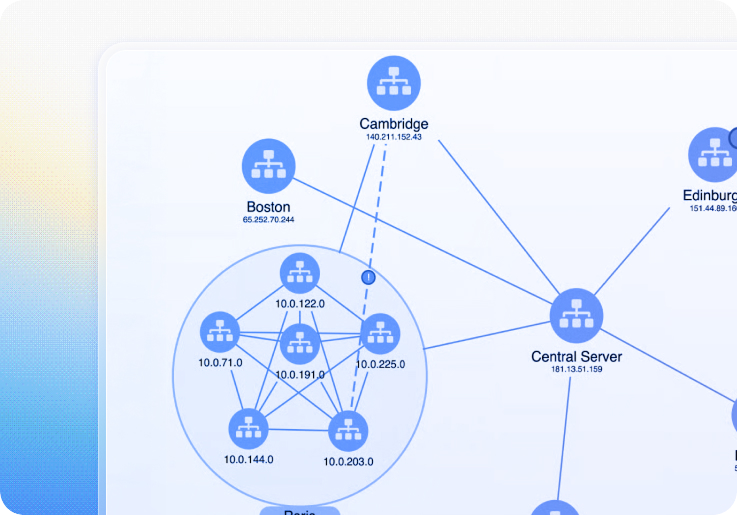
Supply chain and network digital twins

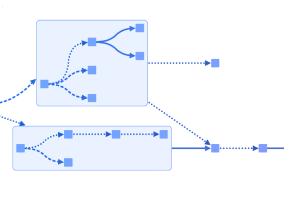
Effective supply chain oversight requires visibility into interdependencies spanning procurement, production, logistics, distribution, and reverse logistics operations. Link analysis has emerged as the standard approach for analyzing complex operational networks at enterprise scale.

Representing supply chain components and flows as connected networks or temporal sequences enables organizations to maintain operational continuity and optimize performance.

Platforms and tools for link analysis

Choosing the right link analysis platform depends on your specific needs: the type of analysis (traditional network, geospatial, temporal), your technology stack, and whether you need an off-the-shelf solution or customizable SDK.

  • Off-the-shelf applications have a defined user interface and experience built into the software – a one-size-fits-all approach. These are ideal for one-off analysis tasks with simple requirements.
  • Software development toolkits (SDKs) give you the flexibility to design and build custom applications that look and behave exactly as your users need them to. These custom applications are easier to use and more effective as a result, because they’re built specifically for your workflows, data, and analytical questions.

Is open source the right option for your project? 


Why choose our link analysis software?

At Cambridge Intelligence, we help developers build link analysis tools that are 100% customized to their users, their data and the questions they need to answer.


KeyLines

KeyLines

The JavaScript SDK for graph visualization

ReGraph

ReGraph

The React SDK for state-driven graph visualization

MapWeave

MapWeave

The geospatial visualization SDK for uncovering hidden connections

KronoGraph timeline visualization

KronoGraph

The timeline visualization SDK for investigating event data at scale